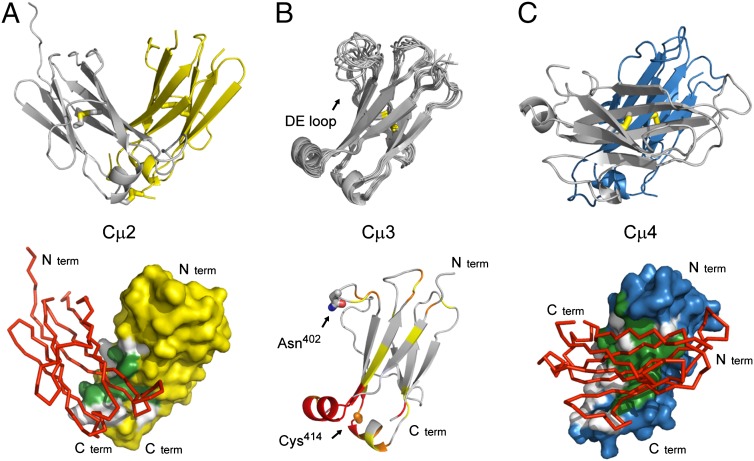
Fig. 2.
Structures of the individual IgM Fc domains. (A) Cartoon representation of the crystal structure of the Cµ2 domain (Upper, Protein Data Bank ID code 4JVU), the arrangement of the two molecules in the crystallographic asymmetric unit forming a stable dimer. Inter- and intramolecular disulfide bonds are shown in stick representation. The surface of one Cµ2 domain (chain A, yellow), showing the contact area with the second Cµ2 domain (chain B, red), is represented as Cα-trace (Lower). (B) Solution structure of the Cµ3 domain (Protein Data Bank ID code 4BA8). Superposition of the 10 lowest-energy NMR structures are shown as cartoon (Upper). The highly flexible DE loop is labeled. Chemical shift perturbations in the Cµ3 domain, when bound to the Cµ4 domain, are shown (Lower). The color scale is as follows: yellow, 0.025–0.05 ppm; orange, 0.05–0.1 ppm; and red, >0.1 ppm. The positions for the interdomain disulfide bridge (Cys414) and the glycosylation site (Asn402) are labeled and shown in stick representation. (C) Cartoon representation of the crystal structure the Cµ4 domain (Upper, Protein Data Bank ID code 4JVW). Intramolecular disulfide bonds are shown in stick representation. The surface of one Cµ4 domain (chain A, blue), showing the contact area with the second Cµ4 domain (chain B, red), is represented as Cα-trace (Lower). Color coding for the interfaces: gray, hydrophilic contact residues; green, hydrophobic contact residues.

