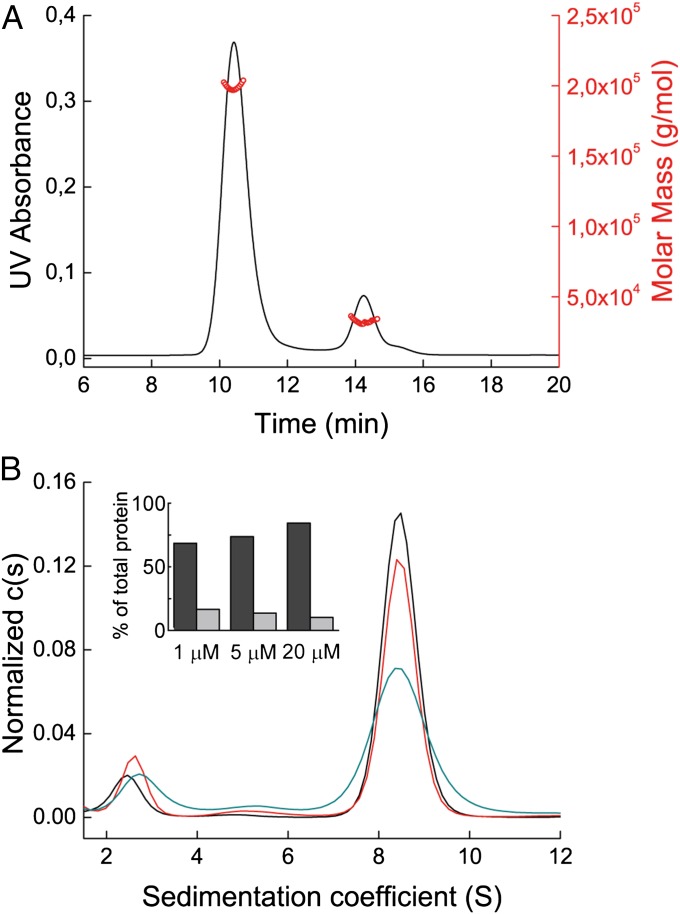
Fig. 3.
Characterization of the Cμ4tp oligomer. (A) SEC MALS profile of the Cµ4tp oligomer. UV absorbance is shown in black, and calculated masses in red. (B) Cµ4tp oligomer characterized by aUC SV runs at 20 μM (black), 5 μM (red), and 1 μM (cyan). The histogram shows the percentages of hexamer of dimers (dark gray) and dimers (light gray) of the total protein in solution.

