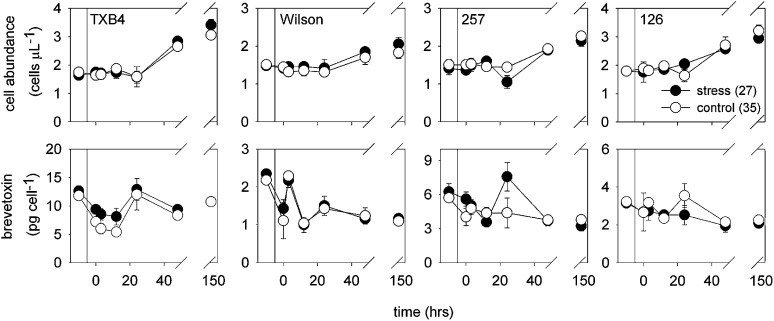
Fig. 3.
Cell concentrations and brevetoxins per cell for strains TX B4, Wilson (low-toxin cell line), 257, and 126 before and at various times after culture dilution and the resulting initiation of osmotic stress (data from laboratory B). Vertical lines indicate the point of culture dilution. Cell concentrations before culture dilution have been adjusted downward by the dilution factor to allow ready comparison with postdilution values. Data represent means of single analyses from four replicate treatment and control flasks. Error bars give associated SDs. If no error is shown, its dimension was less than the size of the data point.

