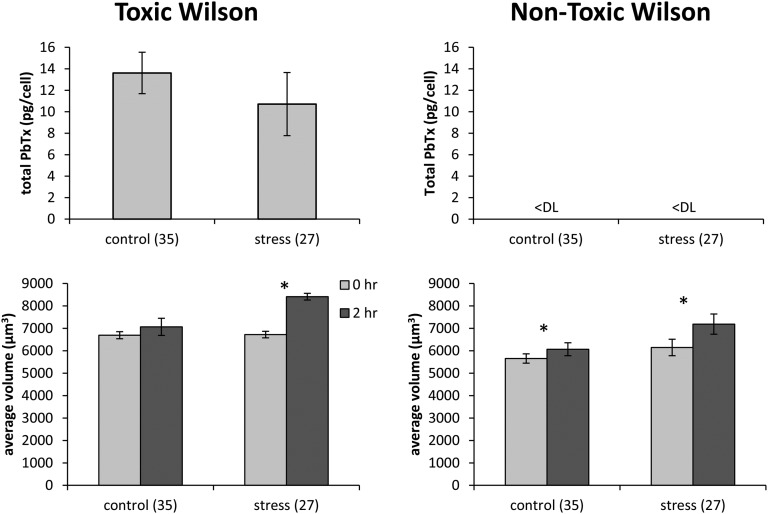
Fig. 4.
Brevetoxin per cell and mean volume per cell for toxic and nontoxic cell lines of the Wilson strain before and after the salinity decrease from 35 to 27 (data from laboratory C). Error bars show SDs for five replicate cultures. Asterisks indicate significant differences between treatment pairs (paired t test, P < 0.05). “<DL” indicates measured values below the detection limit.

