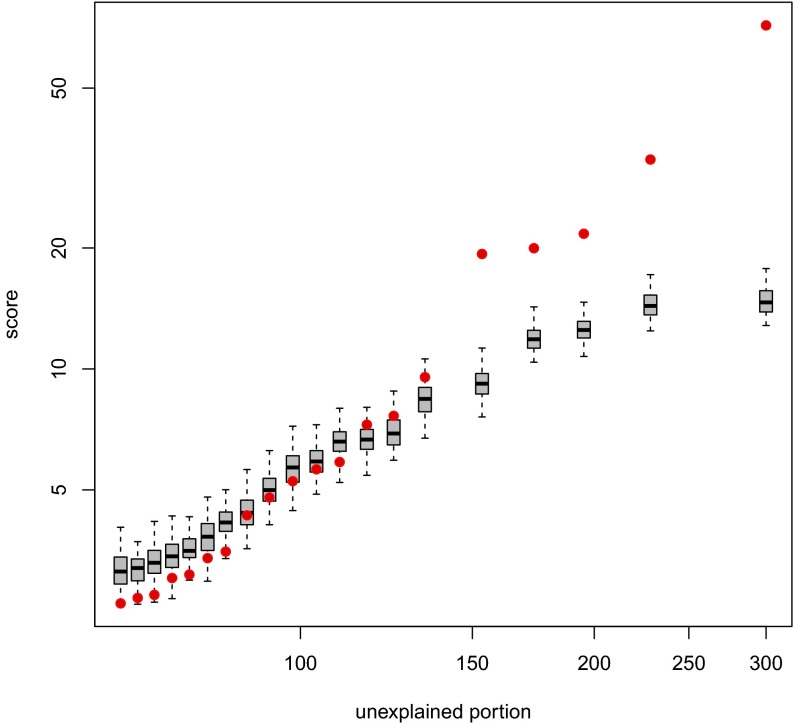
Fig. 2.
Significance analysis of cores derived from a simulated set of 300 events, as illustrated in Fig. 1. The observed scores are shown in red, plotted against the unexplained portion as defined by Eq. 3. Each of the box plots represents the corresponding empirical null distribution of the scores.

