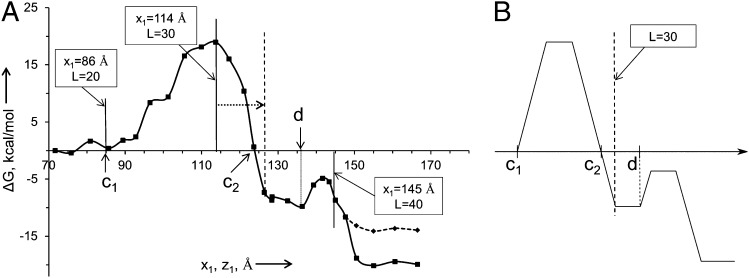
Fig. 3.
The profile for the insertion of the 6L/13A H helical segment. The figure is based on the model used in our previous work (11) but with a more uniform reaction coordinate (SI Text). (A) The actual PMF [scaled by 0.7 to represent the effect of the ribosome (11)]. (B) A schematic generic potential. c1 and d are, respectively, the coordinates where the TR and membrane insertion profiles start to go up. Intersection of the TR insertion profile with the horizontal axis is labeled as c2. Note that the position of L ∼ 30 could be shifted to a larger value of x1, reflecting the stretch of the H segment and other effects (SI Text).

