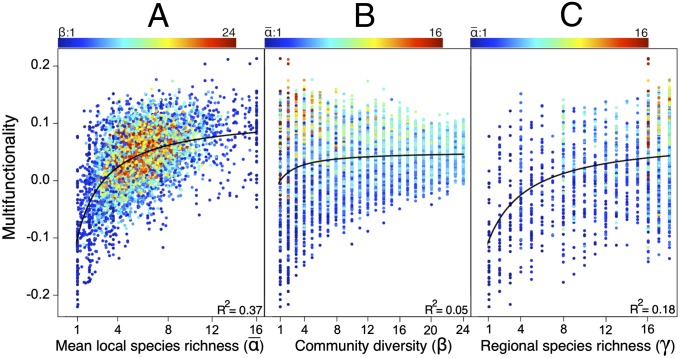
Fig. 2.
Effects of  , β, and γ diversity on MF. Relationships between MF and
  (A), β (B), and γ (C) diversity in 7,512 experimental landscapes.
  and γ increase multifunctionality, while β mainly decreases its variance. Flexible, best-fit saturating curves are not forced through 0 (P < 0.001 for all). β ranges from 1 (blue) to 24 (red) in A and
  ranges from 1 (blue) to 16 (red) in B and C.

