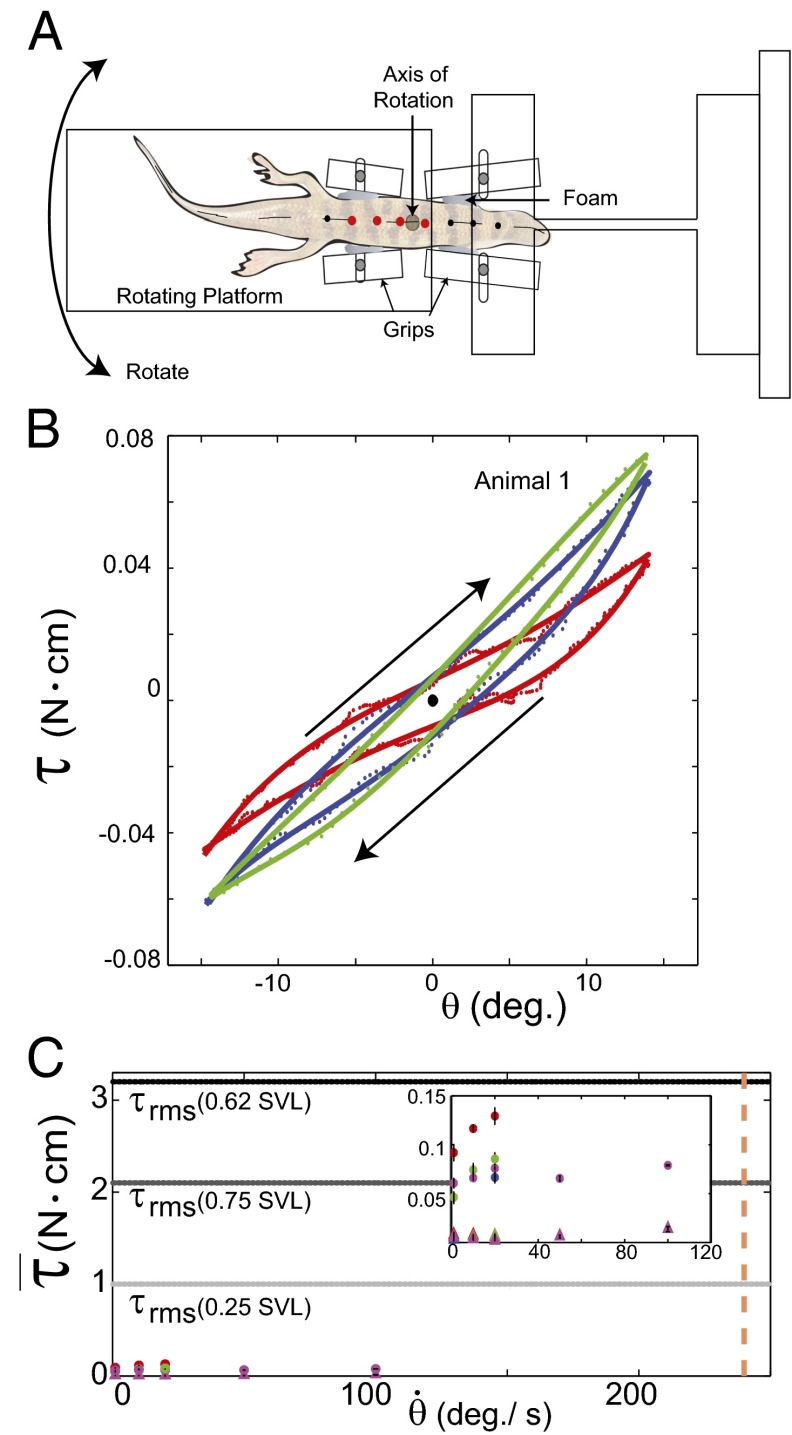
Fig. 7.
Experimental measurements of sandfish body elasticity and damping. (A) Top view of the setup. (B) Representative work loop for animal 1 with angular velocities of  (red),
  (blue), and
  (green). The direction is indicated by the arrows, where the angle is initially zero and increases to ≈0.26 rad (15°), decreases to ≈−0.26 rad (−15°), and then returns to zero. Work loops are shown for constant angular velocity (i.e., the system has reached a steady state). Dotted trajectories represent the experimentally recorded torque; solid curves are the best polynomial fits. (C) Estimated average torque using calculated elastic (circles) and damping (triangles) coefficients is compared with the maximum
  due to external forces calculated from discrete element simulation (34) [0.62 body length (BL); dashed horizontal black line]. Average
  values for 0.25 BL (light gray dashed line) and 0.75 BL (dark gray dashed line) are also shown. For animal 1 (red), animal 2 (blue), and animal 3 (green), coefficients were measured for 1, 10, and 20°/s. In animal 4 (magenta), coefficients were measured for 1, 10, 20, 50, and 100°/s. The average angular speed of a sandfish segment is 240°/s (dashed vertical orange line). (Inset) Zoomed-in region of data in the main figure (units are the same).

