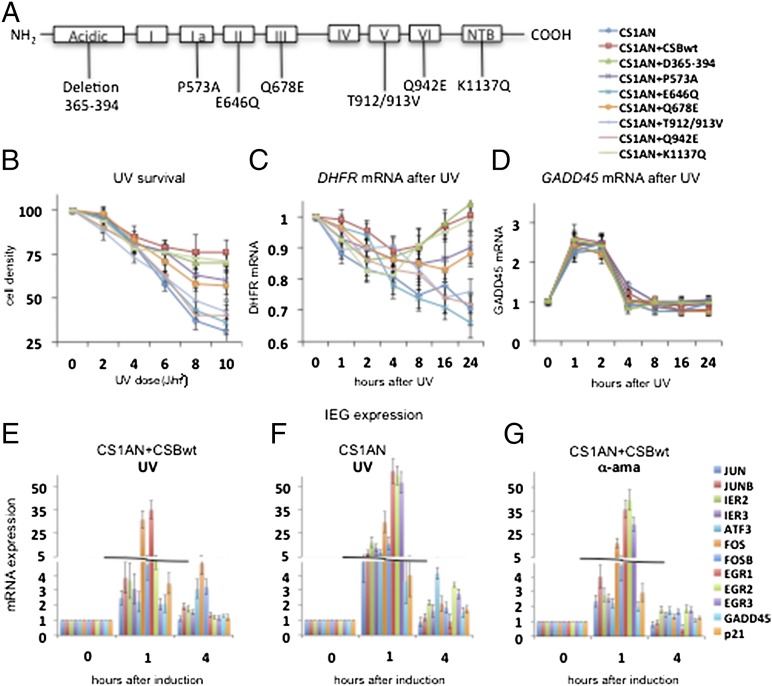
Fig. 1.
Arrest of RNA synthesis and induction of IEGs upon genotoxic stress in CS cells. (A) Schematic diagram of CSB secondary structure showing helicase motifs I–VI and the acidic and NTB domains. Cell lines used were transfected with pcDNA3.1 plasmid carrying point mutations with the denoted locations. (B) UV survival assay showing cell density 4 d after exposure to 0–10 J/m2 UV-C radiation. (C and D) DHFR mRNA (C) and GADD45 mRNA (D) after 10-J/m2 UV-C irradiation. Graphs show the average of three independent experiments. (E–G) A quantitative RT-PCR analysis of the set of IEG in CS1AN+CSBwt and CS1AN cells treated with 10 J/m2 of UV-C or 10 μg/mL of α-amanitin as indicated and harvested at different time points after UV-C irradiation. Genes listed from the top to the bottom at the right of G are shown from left to right in each histogram. ATP7A, ATPase, Cu++ transporting, alpha polypeptide DLD, Dihydrolipoamide dehydrogenase; NBN, Nibrin; RAB3GAP2, RAB3 GTPase activating protein subunit 2;RAD50, RAD50 homolog (S. cerevisiae). Other gene symbols are defined in the text. All results are presented as the ratio of the value obtained at each time point relative to that of the untreated cells at time t = 0. Each point represents the average of three independent experiments that were performed in triplicate.

