Fig. 3.
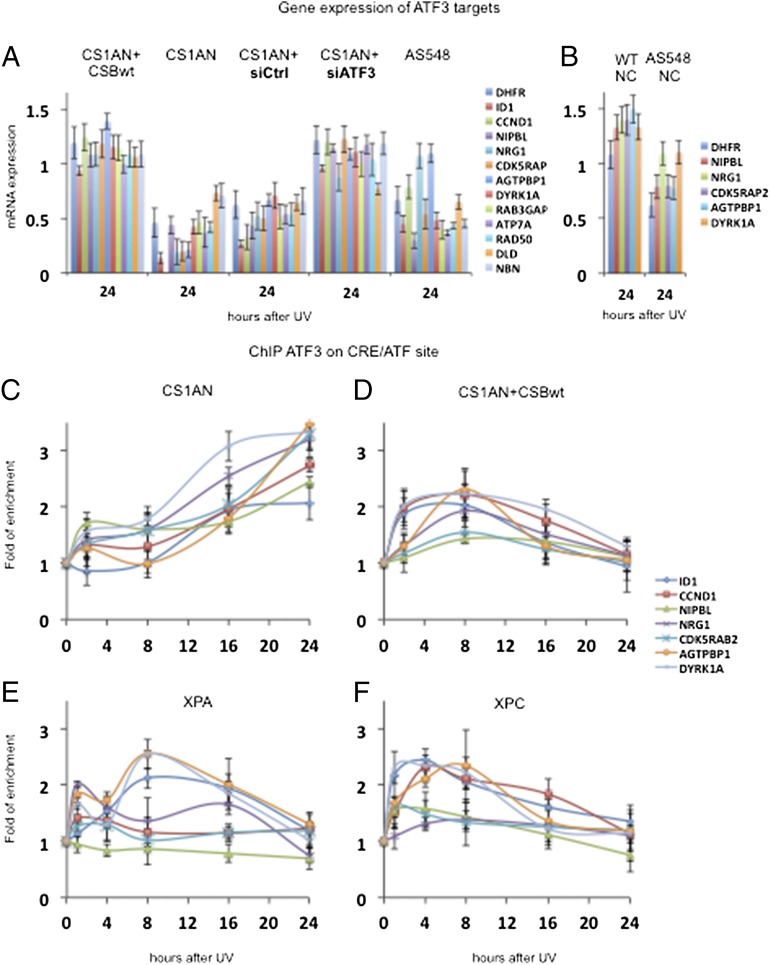
ATF3 binding to CRE/ATF sites and subsequent transcriptional repression of target genes. (A) Quantitative RT-PCR analysis of the ATF3 target genes (shown in Fig. S1H and Table S2) in CS1AN+CSBwt cells, CS1AN cells, CS1AN cells transfected with either siCtrl or siATF3, and AS548 cells (19) 24 h after 10-J/m2 UV-C treatment. (B) Quantitative RT-PCR analysis of the newly identified ATF3 target genes in wild-type (CRL-2097) and AS548 neuronal cultures 24 h after treatment with 10-J/m2 UV-C. Cells were harvested at the 0- and 24-h time points after UV-C treatment. Gene expression at 24 h was normalized to 0 h. (C–F) ChIP assays showing enrichment of ATF3 binding at CRE/ATF sites of selected gene promoters. CS1AN (C), CS1AN+CSBwt (D), XPA (XP12RO) (E), and XPC (GM14867) (F) cells were treated with 10 J/m2-UV-C and harvested at different time points within 24 h. The genes that are named from the top to the bottom at the right in A and B are shown from left to right in each histogram. All the results are presented as fold recruitment, the ratio of the value obtained at each time point relative to that of the untreated cells at time t = 0. Each point represents the average of three real-time PCR reactions of three independent experiments.

