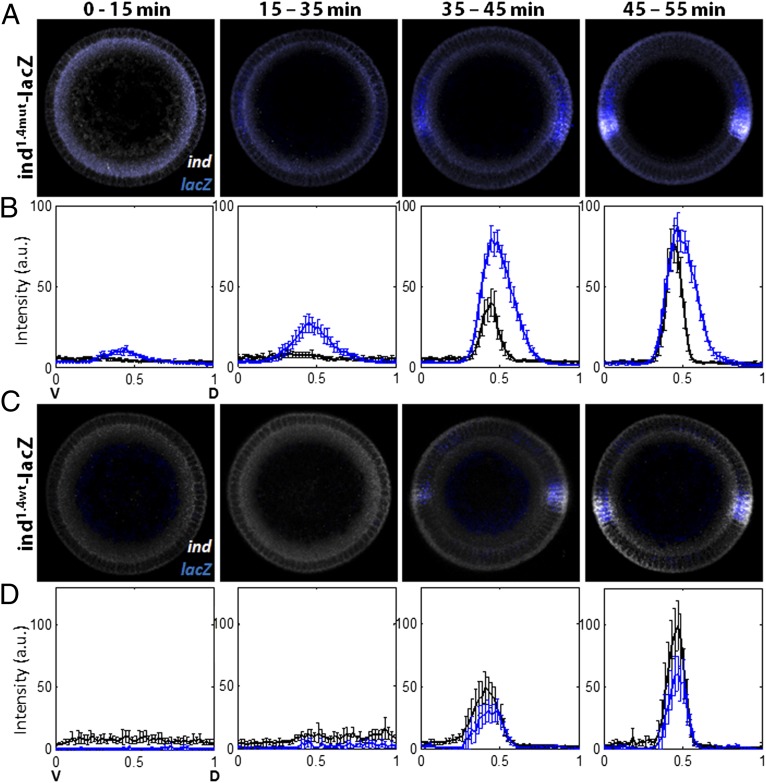
Fig. 3.
Cic binding sites control the spatial pattern and timing of ind expression. Duplex FISH images show expression patterns of the transcripts of ind and lacZ, driven by the mutant (A and B) or WT ind (C and D) enhancers. ind1.4mut-lacZ (A and B) and ind1.4WT-lacZ (C and D) embryos were costained for ind (white) and lacZ (blue), and average signals were quantified for four temporal classes. Phase-contrast images were used to quantify membrane ingression length, which corresponds to a time point in cycle 14. Expression patterns are plotted from ventralmost (x = 0) to dorsalmost (x = 1) point. (A and B) Expression of ind1.4mut-lacZ is dorsally expanded relative to the ind pattern. Note the premature activation of ind1.4mut-lacZ expression during early/mid-cycle 14 (∼20 min after cycle 14, and before ERK pathway activation, based on Fig. 1). Totals of 19, 10, 13, and 13 embryos were examined for each class, respectively, and error bars correspond to SEM. (C and D) Expression of ind1.4WT-lacZ and that of endogenous ind pattern matches in its spatial and temporal pattern. In both cases, the expression is first observed ∼40 min after start of cycle 14, which is after the activation of ERK pathway. The numbers of embryos used for each class are 7, 5, 15, and 8, respectively. Error bars correspond to SEM.

