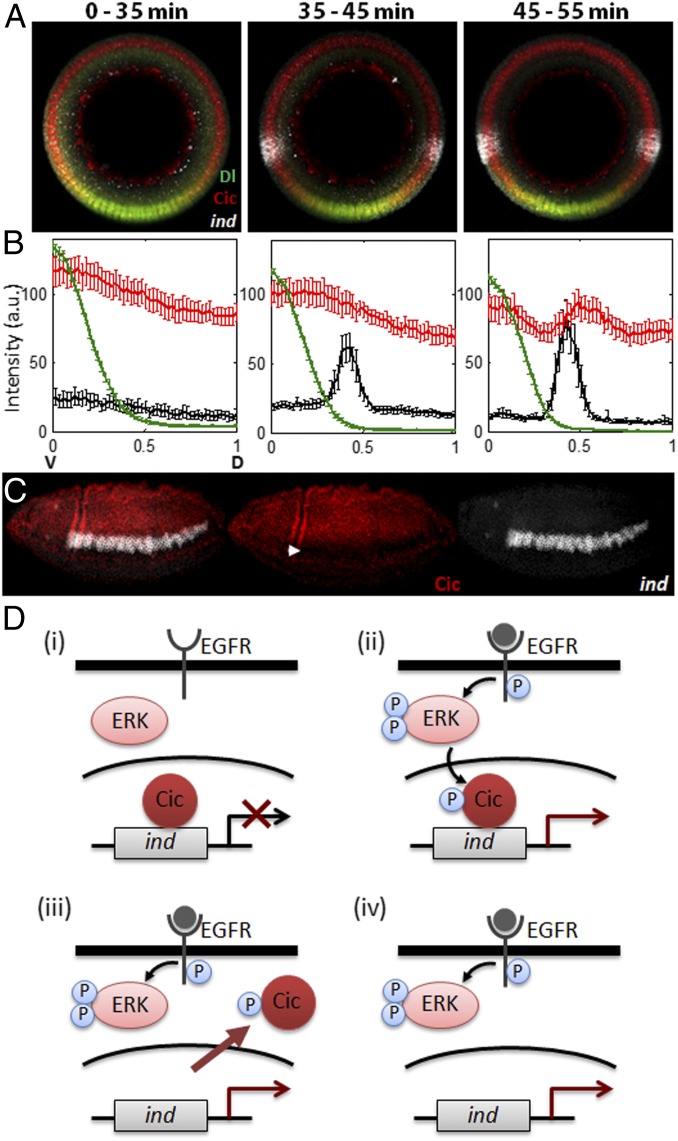
Fig. 4.
Induction of ind precedes down-regulation of Cic nuclear levels. (A and B) WT embryos were costained for Dl (green), Cic (red), and ind mRNA (white), and average signals (y axis) were quantified along the DV axis (x-axis) for three distinct temporal classes. Phase-contrast images were taken to measure membrane ingression length, and each embryo was given a time point based on its length. Zero corresponds to the ventralmost point of the embryo. Before ind derepression, Cic nuclear levels are uniform (Left). Cic nuclear levels appear uniform at the stage when ind is derepressed (Center). Cic level begins to decrease only around the time of gastrulation (Right). The numbers of embryos in each temporal class are 14, 15, and 12, respectively, and error bars correspond to SEM. (C) Expression of Cic (red) and ind (white) in a gastrulating embryo (∼3 h 10 min after egg laying). Note the significant decrease of Cic nuclear levels in dpERK and ind expressing domain (solid arrowhead). (D) Schematic representation of the two-tiered model of RTK-dependent antagonism of gene repression by Cic. EGFR-mediated activation of ERK phosphorylates Cic (i), which immediately relieves its repression on ind (ii). Phosphorylated Cic is then exported to cytoplasm (iii) and subject to degradation (iv).

