Fig. 5.
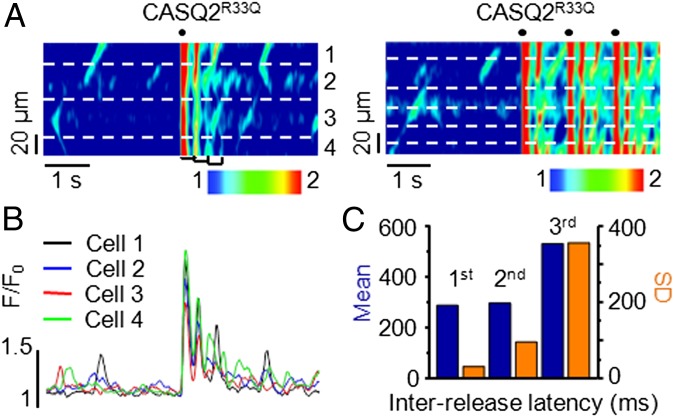
High degree of DCR synchronicity in CASQ2R33Q intact cardiac muscles. (A) Line-scan images of a CASQ2R33Q muscle challenged with 100 nM ISO and 10 mM [Ca2+]o, showing DCR timing properties at rest and after a single electrical stimulation (Left) or a train of three stimuli (Right). (B) Fluorescence signals from each myocyte in the line-scan image of the CASQ2R33Q muscle shown in A, Left. (C) Mean and SD of the interrelease latencies for the first three Ca2+ oscillations as marked by the brackets in the line-scan image in A, Left. Data are representative of five experiments.

