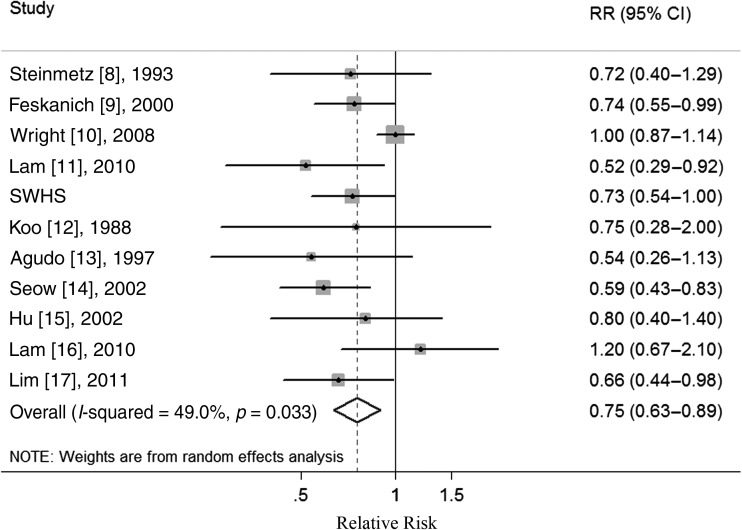
Figure 1.
Forest plot (random effects model) of cruciferous vegetables (CVs) consumption and female lung cancer risk in observational studies. Squares indicate study-specific relative risks (size of the square reflects the study-specific statistical weight); horizontal lines indicate 95% CIs; diamond indicates the summary relative risk estimate with its 95% CI. CI: confidence interval; RR: relative risk; SWHS: the Shanghai Women's Health Study.

