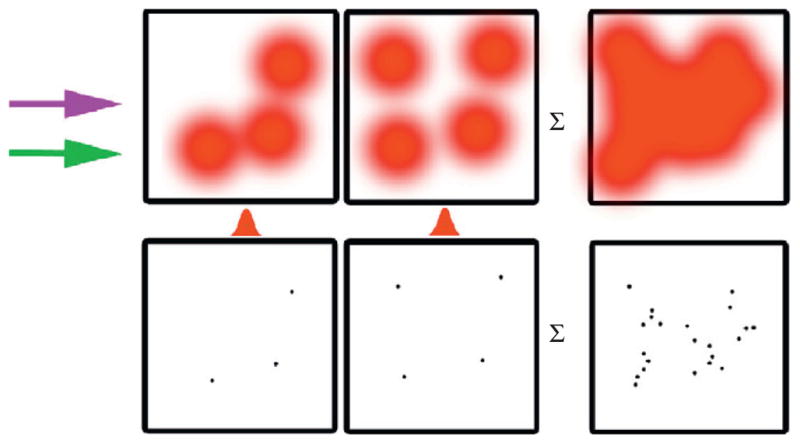
Figure 5.1. Schematic of PALM analysis.

Raw data are acquired (top row) under continuous activation and excitation, then the image of each molecule is fit with a Gaussian to yield nanometric position information (bottom row). The summed information provides high-density, high-resolution molecular maps.
