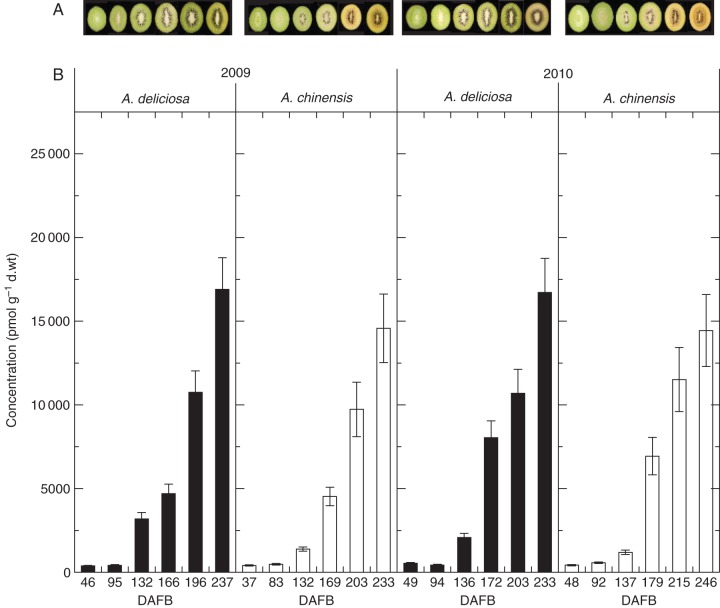
Fig. 1.
Colour change and total cytokinin concentration in green and gold kwifruit during fruit development in 2009 and 2010. (A) In 2009, the photographs of green fruit were taken at 46, 95, 132, 166, 196 and 237 days after full bloom (DAFB) (left to right) and the photographs of gold fruit were taken at 37, 83, 132, 169, 203 and 233 DAFB (left to right). In 2010, the photographs of green fruit were taken at 49, 94, 136, 172, 203 and 238 DAFB (left to right) and the photographs of gold fruit were taken at 48, 92, 137, 179, 215 and 246 DAFB (left to right) in 2010. (B) Total cytokinin complement in green and gold fruit in 2009 (left) and 2010 (right). Green fruit samples are shown as black columns and gold fruit samples are shown as white columns. Bars are one standard error above and below the mean of technical replicates (n = 3).

