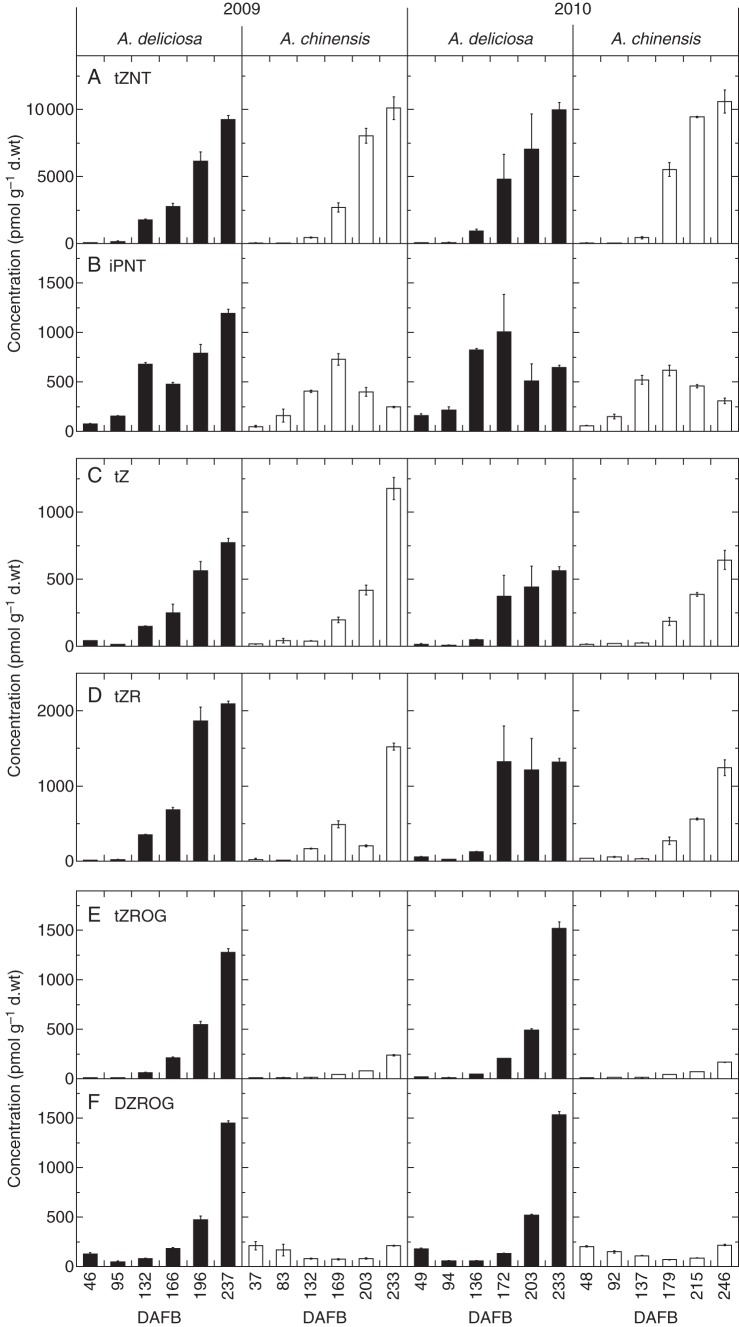
Fig. 2.
Concentration of major cytokinin metabolites in green and gold kiwifruit during fruit development in 2009 (left) and 2010 (right). Green fruit samples are shown as black columns and gold fruit samples as white columns. (A) Cytokinin nucleotides, (B) free bases, (C) ribosides and (D) O-glucosides. Bars are one standard error above and below the mean of technical replicates (n = 3). DAFB, days after full bloom.

