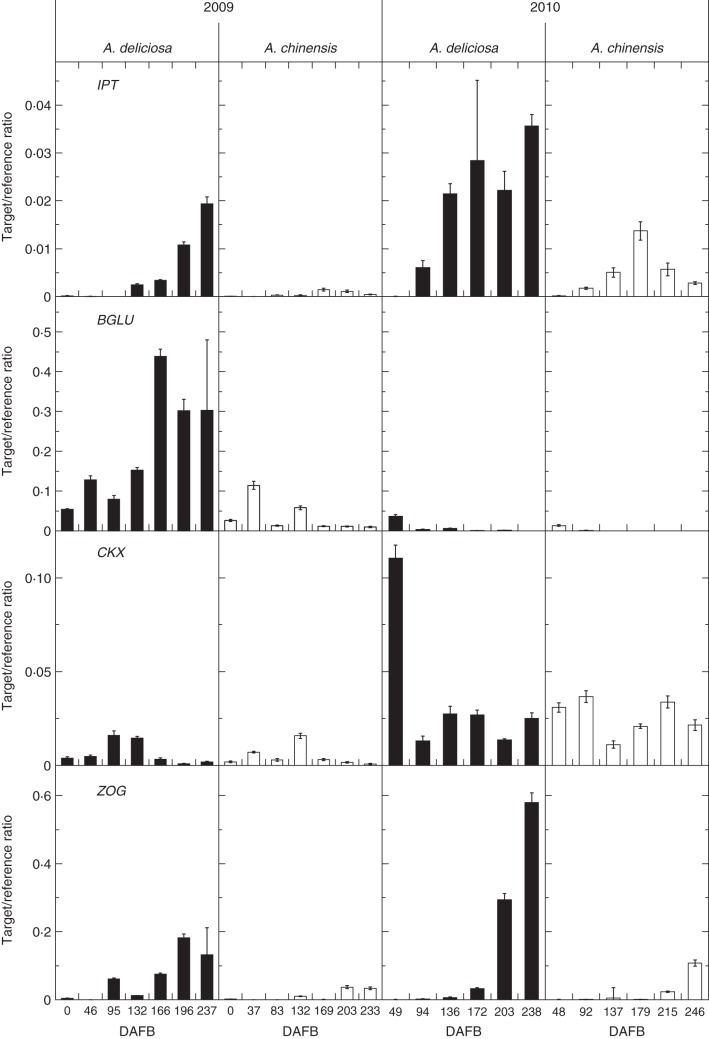
Fig. 3.
Expression of cytokinin biosynthetic and metabolism genes in green and gold fruit during development in 2009 (left) and 2010 (right) measured as a target/reference ratio. Green fruit samples are shown as black columns and gold fruit samples as white columns. Bars are one standard error above and below the mean (n = 4). DAFB, days after full bloom.

