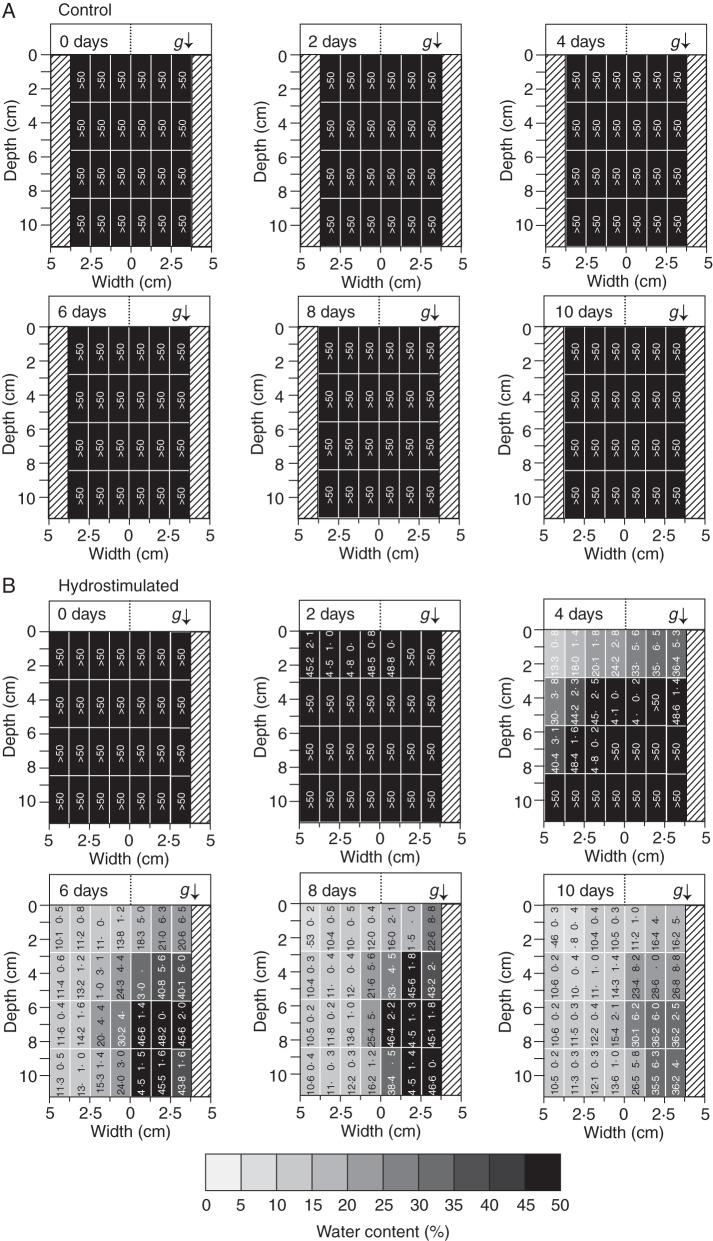
Fig. 3.
Soil water distribution in control and hydrostimulated chambers. (A) Water distribution in the absence of hydrostimulation (Control) and (B) in the presence of hydrostimulation (Hydrostimulated) are shown. The soil media in control and hydrostimulated chambers were divided into 24 and 28 zones, respectively, and the water content in each zone was measured at time zero and 2, 4, 6, 8, and 10 d after hydrotropic stimulation. The bottom bar shows water contents as grey scales, which correspond to those of the water distribution map shown above. The arrow (g) indicates the direction of the gravitational force. Data show the means ± s.e. (n = 4).

