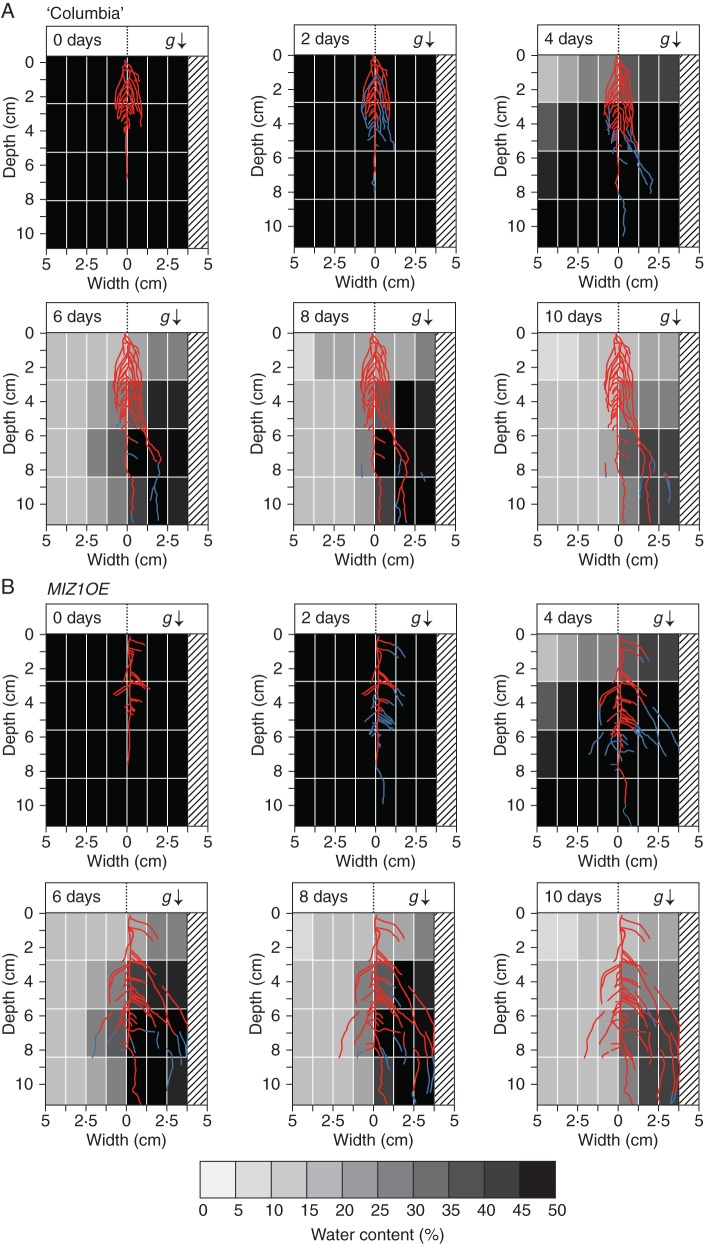
Fig. 6.
Effects of MIZ1 overexpression on root system development of plants grown in the hydrostimulation chambers. The root system images of (A) wild-type and (B) MIZ1OE plants were obtained at time zero and 2, 4, 6, 8 and 10 d after hydrotropic stimulation, and these images were merged with images of the water distribution shown in Fig. 2. Blue lines indicate the root regions that elongated during the preceding 2 d of growth (when the previous image was captured). The bottom bar shows water contents as grey scales, which correspond to those of the water distribution map shown above. The root system of a representative seedling is shown for each time point of imaging. Numbers of seedlings used and experiments repeated correspond to those of Table 1. The arrow (g) indicates the direction of gravitational force.

