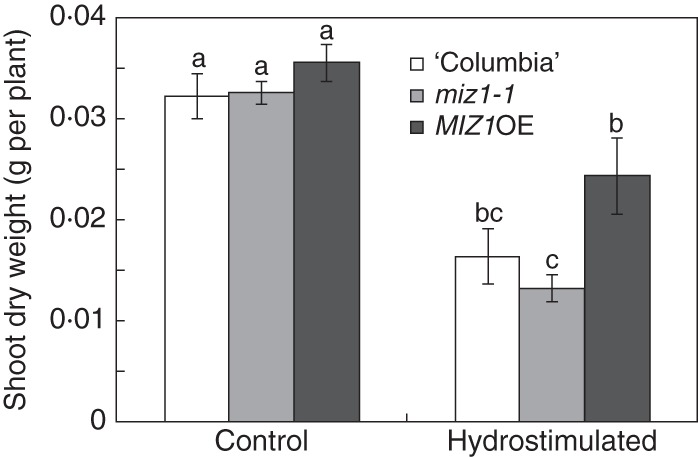
Fig. 8.

Effect of hydrotropic response on biomass production of wild-type (‘Columbia’), miz1-1 and MIZ1OE plants. Seedlings were grown in the absence (Control) and presence (Hydrostimulated) of hydrotropic stimulation for 30 d, and the dry weights of the shoots were measured. Data are means ± s.e. (n = 11–20). Different letters above the bars indicate statistically significant differences at P < 0·05 by Tukey's HSD.
