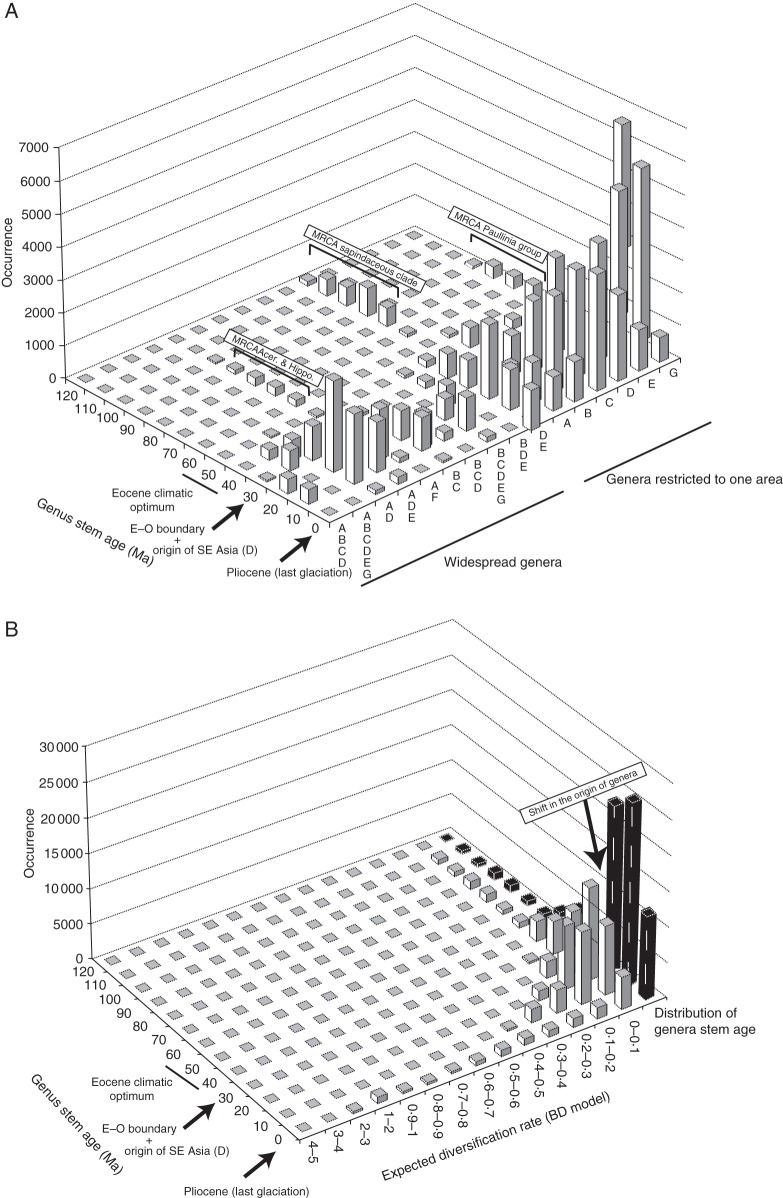
Fig. 1.
(A) 3-D barplot showing the stem age of the genera of the sapindaceous clade (x-axis) as a function of their distribution (y-axis) and occurrence (z-axis). Abbreviations: A, Eurasia from Western Europe to Indochina; B, Africa; C, Madagascar, including the Comoro Islands and the Mascarene Islands; D, South-East Asia including India, the Malaysian Peninsula, Philippines, Sumatra, Borneo, and the Inner Banda Arc, as well as the Pacific Islands (e.g. Hawaii); E, Australia including New Guinea, New Caledonia and New Zealand; F, North America; and G, South America including Central America and the West Indies. (B) 3-D barplot displaying the age of the genera of the sapindaceous clade (x-axis) as a function of their expected birth–death diversification rates (y-axis) and occurrence (z-axis). The distribution of generic stem ages through time (in black) is also presented on the graph. See Fig. 3 for a map of area distribution. BD, birth–death; Ma, million years ago.

