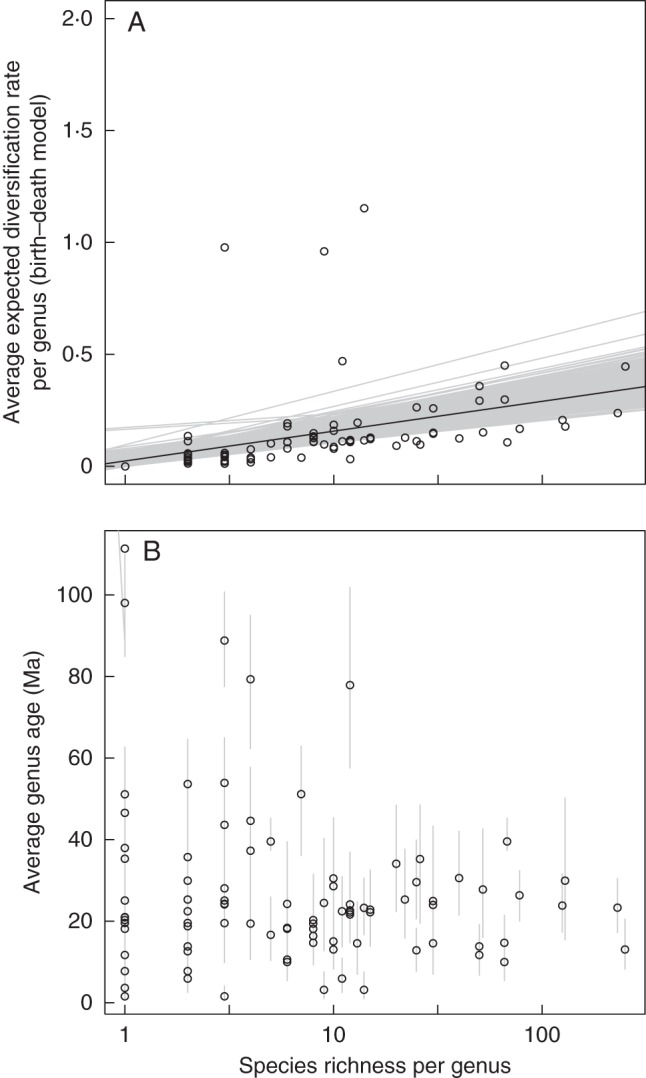
Fig. 2.

(A) Average expected diversification rate (based on a birth–death model) per genus of the sapindaceous clade displayed according to the generic species richness based on the 900 BEAST trees. Linear correlations (in grey) are also represented. (B) Average genus stem age (in Ma) as a function of species richness per genus. Error bars indicate 95 % confidence intervals on the node. For both panels the species richness per genus was log-transformed.
