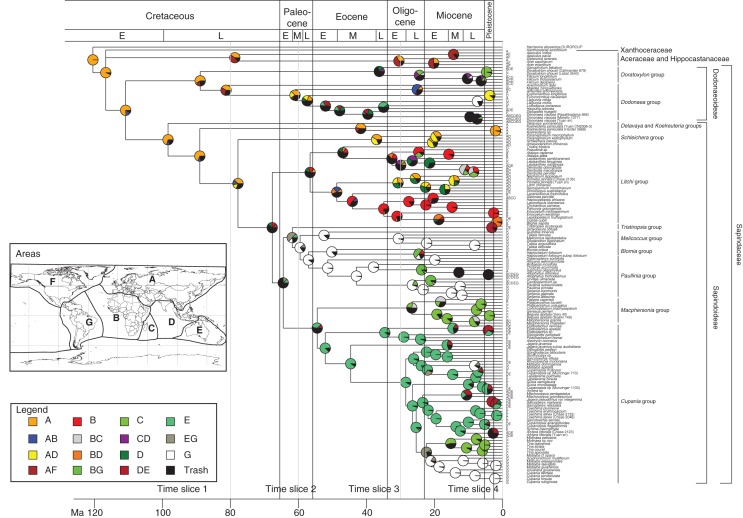
Fig. 3.
Biogeographical reconstruction of the sapindaceous clade based on 100 Lagrange analyses constrained with the paleogeographical model published in Buerki et al. (2011a) and plotted on the BEAST majority rule consensus tree. Pie charts on nodes represent probabilities for assigned ancestral area(s). The classification follows Buerki et al. (2009, 2010). See the Materials and Methods section for more details on the paleogeographical model and Fig. 1 for area definitions. Ma, million years ago.

