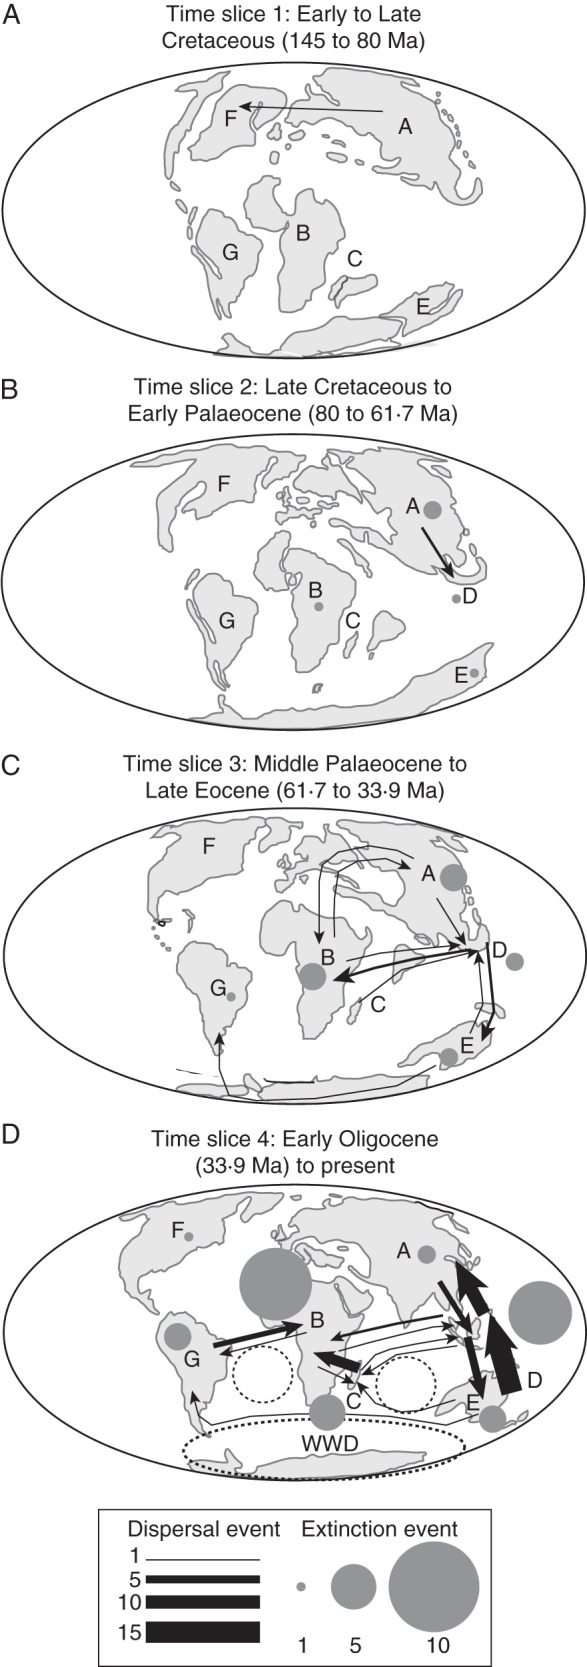
Fig. 4.

Biogeographical scenario of the sapindaceous clade inferred from the 100 Lagrange analyses (see Supplementary Fig. S2). Dispersals and extinctions are represented in proportion to their occurrence by arrows and circles, respectively. Paleogeographical maps were adapted from Buerki et al. (2011a). See Figs 1 and 3 for abbreviations.
