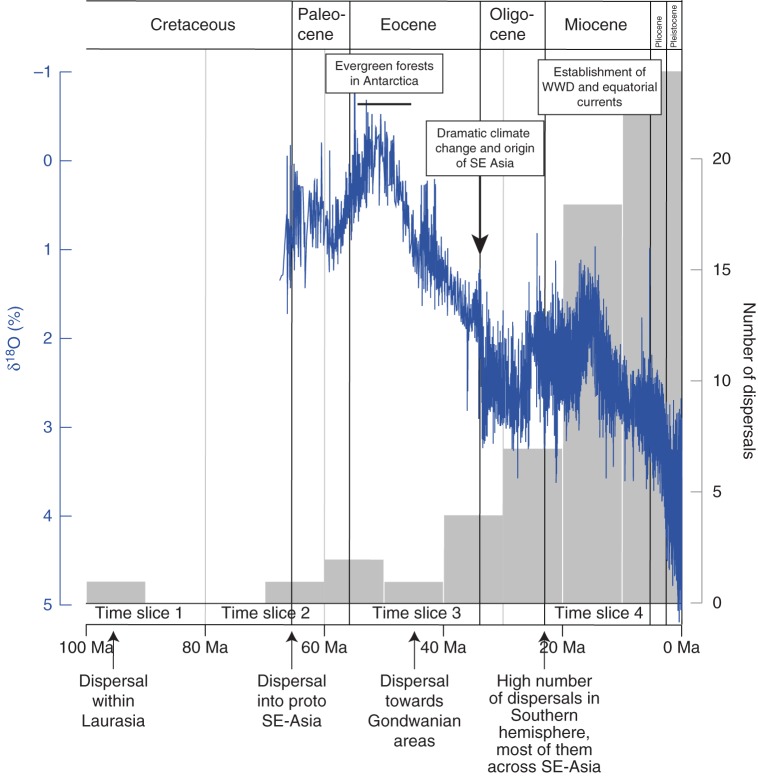
Fig. 5.
Occurrence of dispersal events through time for the sapindaceous clade inferred by the Lagrange analyses (grey bars). Climatic oscillations (blue lines), estimated from the variation of oxygen-18 isotope concentration through time, is also displayed (Zachos et al., 2001). Ma, million years ago.

