
Figure 5.
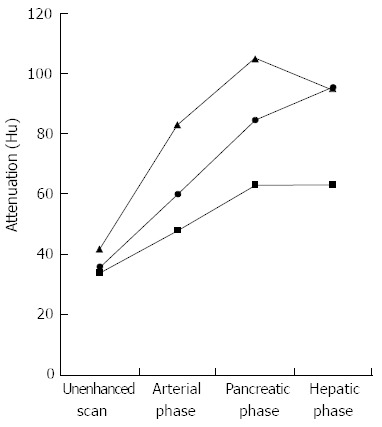
Graph shows mean computed tomography attenuation values of normal pancreatic parenchyma (triangle) and lesions in patients with focal autoimmune pancreatitis (circle) and pancreatic cancer (square) in relation to phase of contrast enhancement.