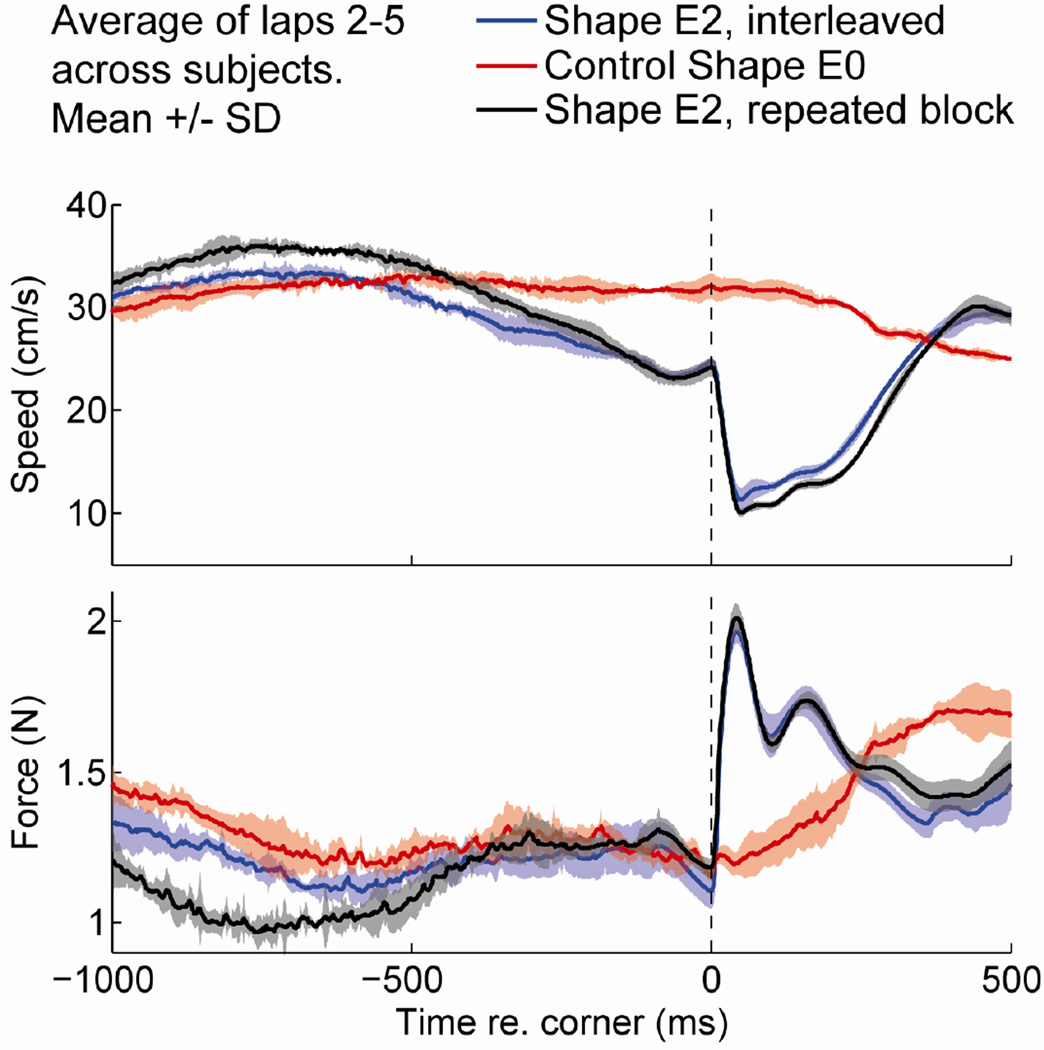
Fig. 5.
Finger speed (top) and contact force (bottom) for subjects exploring the 0-deg tilted ellipses in different conditions. The black trace represents shape E2 (0-deg tilted ellipse with flattening) in trials that were interleaved with the other shapes; the red trace represents shape E0 (0-deg tilted ellipse without flattening); the blue trace represents E2 for a block in five consecutively repeated trials presented at the end of the experiment. Each line shows the mean across subjects, repetitions, and laps 2–5 (6 subjects × 5 repetitions × 4 laps = 120 time traces), aligned to the onset of flattening (vertical, dashed line at t = 0). Shaded area represents the standard deviation.

