
Figure 1. Prediction of Physical Pain on the Basis of Normative Data from Other Participants in Study 1.
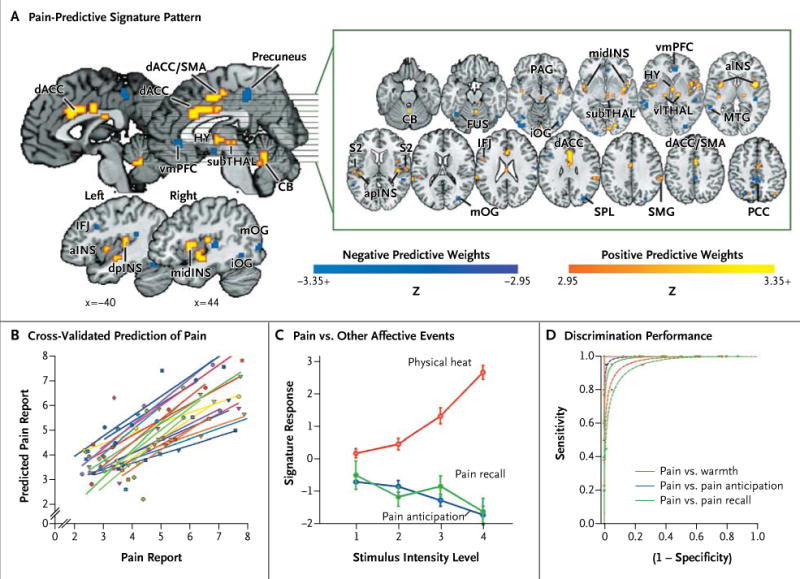
Panel A shows the signature map, consisting of voxels in which activity reliably predicted pain. The map shows weights that exceed a threshold (a false discovery rate of q < 0.05) for display only; all weights were used in prediction. ACC denotes anterior cingulate cortex, CB cerebellum, FUS fusiform, HY hypothalamus, IFJ inferior frontal junction, INS insula, MTG middle temporal gyrus, OG occipital gyrus, PAG periaqueductal gray matter, PCC posterior cingulate cortex, PFC prefrontal cortex, S2 secondary somatosensory cortex, SMA supplementary motor area, SMG supramarginal gyrus, SPL superior parietal lobule, TG temporal gyrus, and THAL thalamus. Direction is indicated with preceding lowercase letters as follows: a denotes anterior, d dorsal, i inferior, l lateral, m middle, mid mid-insula, p posterior, and v ventral. Panel B shows reported pain versus cross-validated predicted pain. Each colored line or symbol represents an individual participant. Panel C shows the signature response versus the pain intensity for heat, pain-anticipation, and pain-recall conditions. Signatureresponse values were calculated by taking the dot product of the signature-pattern weights and parameter estimates from a standard, single-participant general linear model, with regressors for each condition. The estimates shown are derived from cross-validation, so that signature weights and test data are independent. I bars indicate standard errors. The receiver-operating-characteristic plots in Panel D show the tradeoff between specificity and sensitivity. Lines are fitted curves, assuming gaussian signal distributions. The test of pain versus no pain and the forced-choice test are shown by dashed lines and solid lines, respectively. Performance on the forced-choice test was at 100% for all conditions; thus, the lines are overlapping.