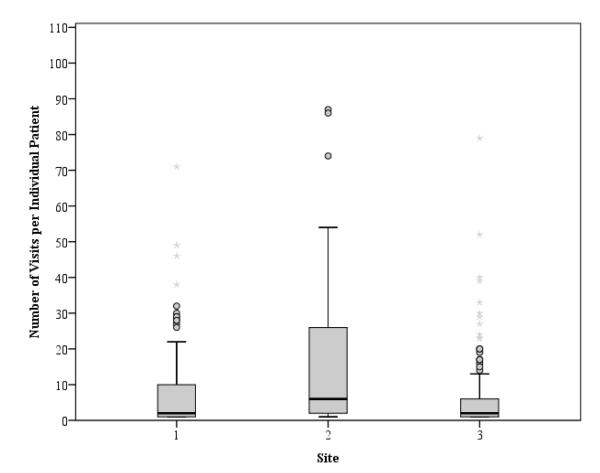
Figure1. Number of Visits per Individual Patient by Study Site.
The boxplots represent the variability in the number of visits per individual patient at each site. The solid line represents the median, and the upper and lower ends of the “box” represent the 25th and 75th percentiles. The outer bars represent the 10th and 90th percentiles.

