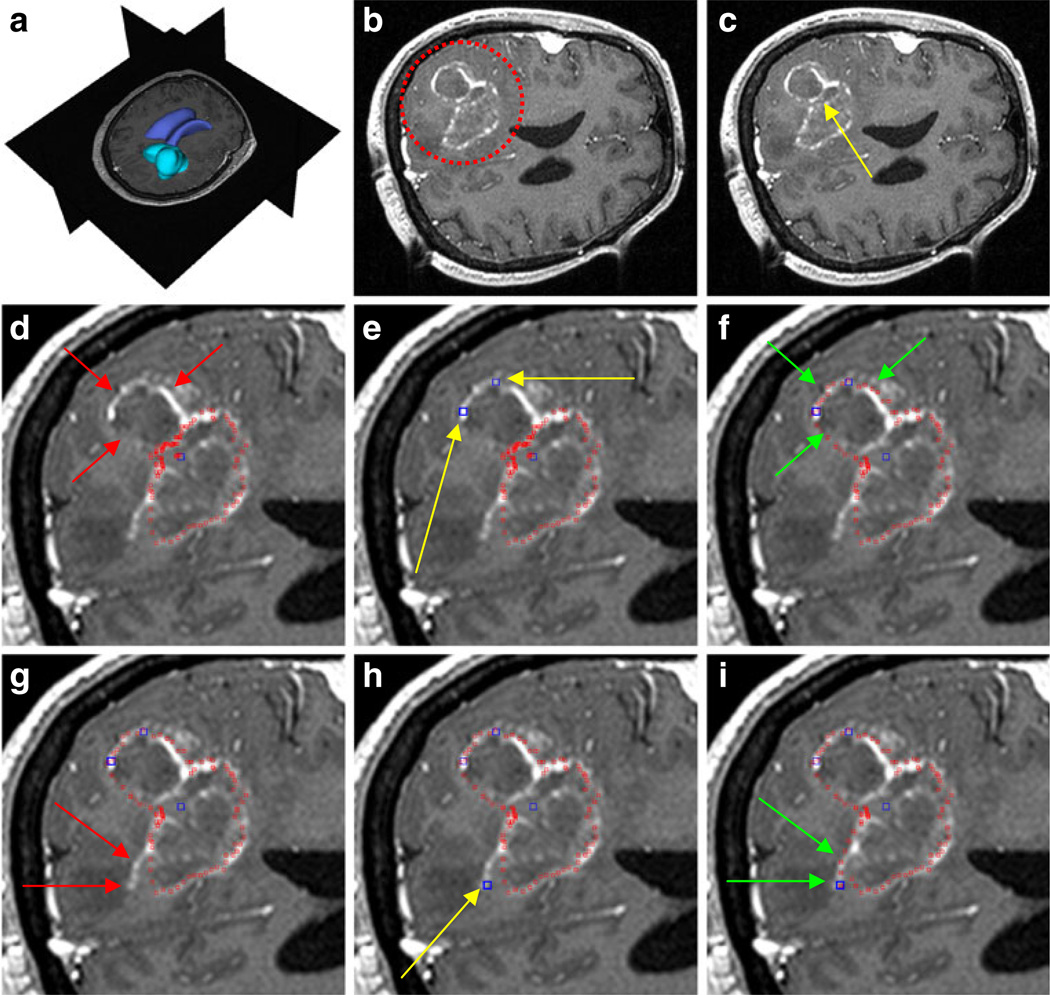
Fig. 6.
The principle of using the manual refinement method for an under-segmented glioblastoma multiforme (GBM) in a MRI scan. a: 3D visualization of the MRI dataset with the tumor in turquoise and the ventricle in blue (performed with Slicer, see http://www.slicer.org/). b: location of the GBM (red circle). c: position of the user-defined seed point inside the GBM (yellow arrow). d: segmentation result (red spots) and missed GBM boundary (red arrows). e: position of two additional user-defined seed points (blue) along the GBM boundary (yellow arrows). f: segmentation results (red spots) after the additional seed points have been included into the graph (green arrows). g: missed GBM boundary (red arrows). h: position of an additional user-defined seed point (blue) placed along the GBM boundary (yellow arrow). i: final segmentation results (red spots) after three additional seed points have been placed on the image and therefore included into the graph. Green arrows indicate the new boundary around the last seed that has been included into the graph

