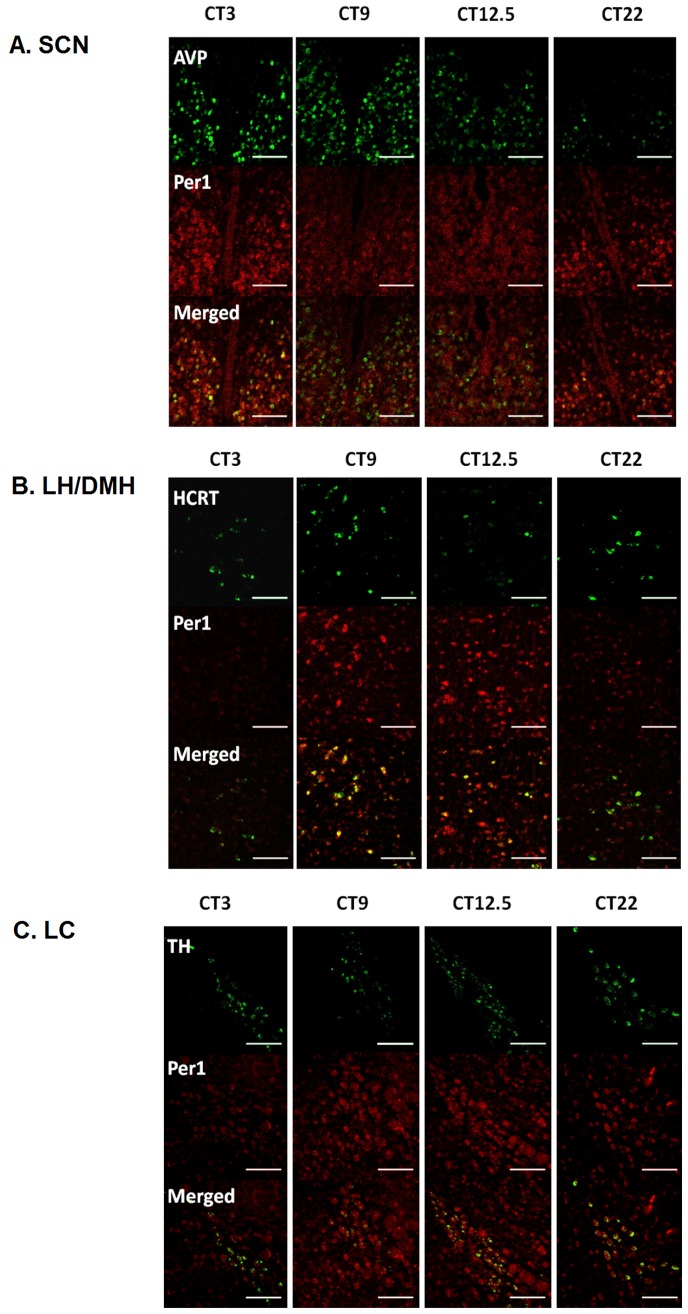
Figure 1. Representative confocal images taken at the level of the (A) SCN, (B) perifornical LH/DMH, (C) LC.
Within each brain region, top row shows cells detected in the Alexa488 channel, middle row shows the HNPP/FR signal indicating Per1 and bottom row is the merged image. A single ∼1micron thick section of a 10 section z-stack was selected as a representative image. Scale bar equals 100 microns. Within each brain region, a section taken from representative animals killed at CT3, CT9, CT12.5 or CT22 is shown.

