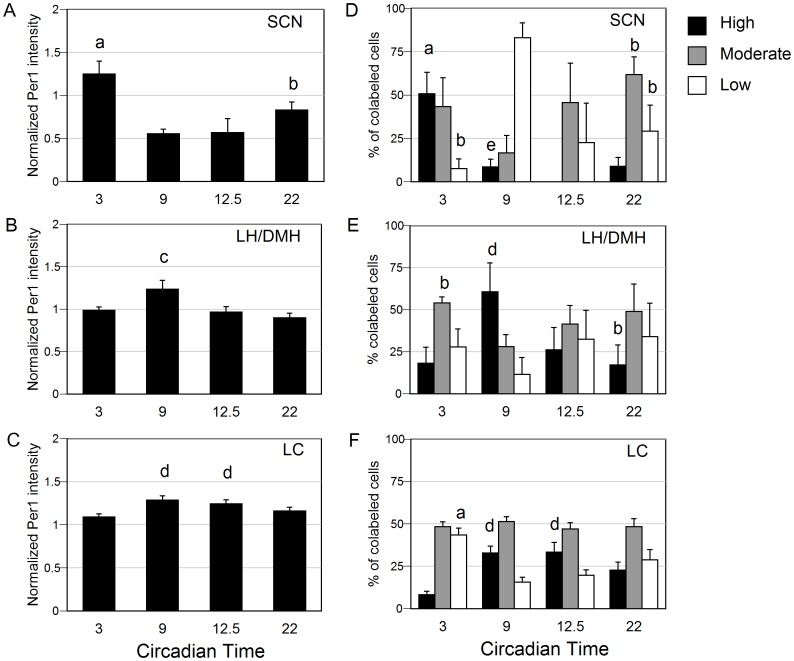
Figure 2. Assessment of Per1 expression in experiment 1.
Left panels show mean colocalization of Per1, and right panels indicate distribution of Per1 expression intensities at each circadian phase, for AVP, HCRT, and TH cells in the brain areas examined. Normalized mean (± SEM) intensity values of Per1 expression is depicted within (A) AVP-expressing cells of the SCN, (B) HCRT-expressing cells of the LH/DMH and (C) TH-expressing cells of the LC. Percent of cells expressing highest 25% (black), moderate (grey), or lowest 25% (white) levels of Per1 within (D) AVP-expressing cells of the SCN, (E) HCRT-expressing cells of the LH/DMH and (F) TH-expressing cells of the LC. a- p<0.05 vs. CT9, 12.5, 22; b- p<0.05 vs. CT9; c- p<0.05 vs. CT3, 12.5; d- p<0.05 vs. CT3; e- p<0.05 vs. 12.5.

