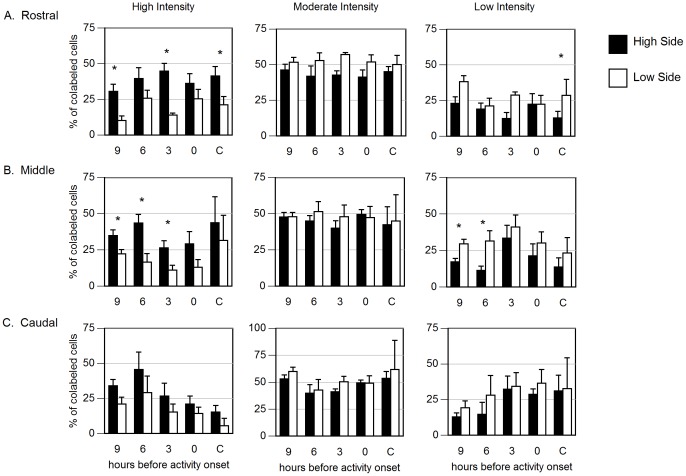
Figure 4. Assessment of the distribution of Per1 expression intensities in the SCN of hamsters exposed to LL.
Distribution of cells expressing high (left), moderate (middle two quartiles; center) or low (right) intensity of Per1 hybridization in (A) Rostral, (B) Middle or (C) Caudal SCN. * p<0.05 vs. low side.

