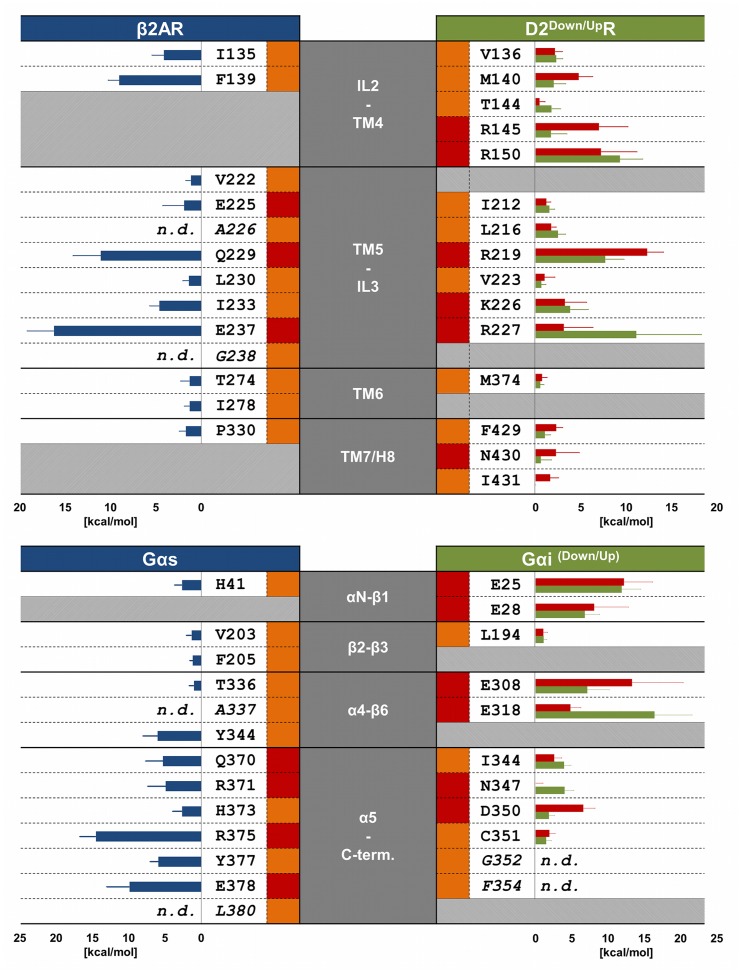
Figure 5. Summary of selectivity determining amino acids within theβ2AR-Gαs- and the D2R-Gαi-complexes and representative values of the alanine scanning mutagenesis.
The grey columns in the middle refer to the regions within GPCRs and G-proteins, to which the mentioned amino acids belong. Amino acids in italic letters have not been mutated in the computational alanine scanning (n.d.). Blue, green and red bars show the binding free energy differences of the alanine scanning mutagenesis for the β2AR-Gαs complex and the D2DownR-Gαi and the D2UpR-Gαi-complexes, respectively. The orange and red rectangles besides the amino acids correspond to hydrophobic or polar interactions to other residues, respectively.

