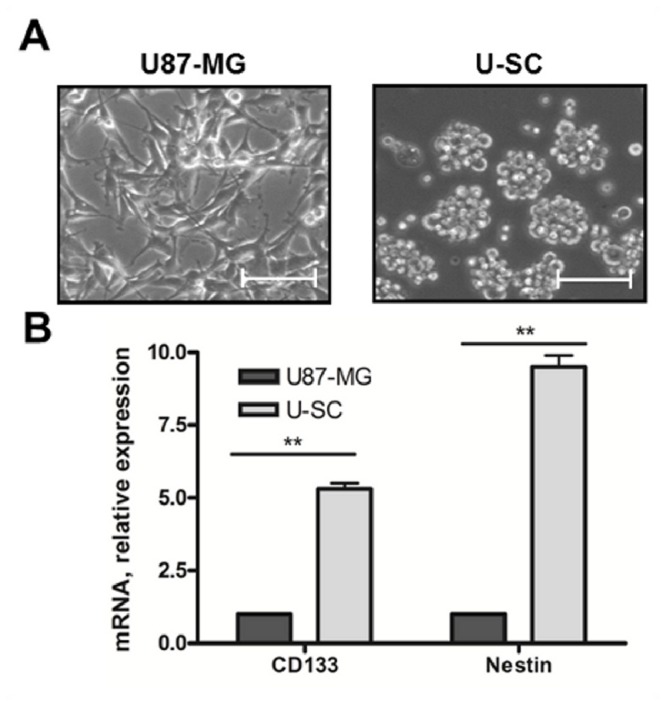
Figure 1. Characterization of cell models.

(A) Representative images of U87-MG and U–SC morphology. Images were viewed on a contrast phase microscope and digital images were acquired (magnification, 10X; scale bar, 100 µm). (B) Expression of CD133 and nestin, assessed by Real-Time PCR. Results are expressed as fold-change relative to U87-MG. Values are the mean ± SD of three independent experiments. * p < 0.05; ** p <0.01 vs U87-MG cells.
