
Figure 4. Hexose sugar substrate specificity of fgt-1.
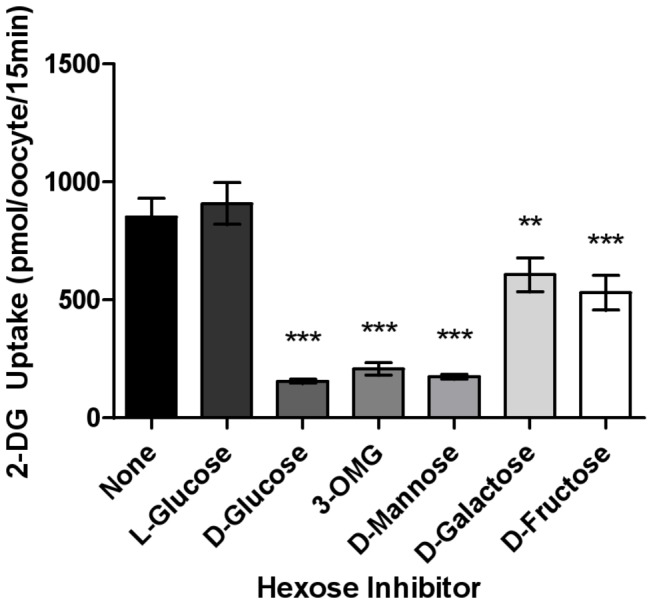
Oocytes injected with either fgt-1 cRNA or water were exposed to 10 mM 2-DG containing 3H-2-DG and 30 mM concentrations of L-glucose, D-glucose, 3-O-methylglucose (3-OMG), D-mannose, D-galactose, or D-fructose for 15 min. 2-DG uptake from water-injected oocytes was subtracted from fgt-1 cRNA-injected oocytes. Error bars represent SEM (n = 40). Statistical analysis was conducted using Dunnett’s one-way ANOVA before the Tukey-Kramer HSD test, with L-glucose as the control group (**P < 0.01, ***P < 0.001).