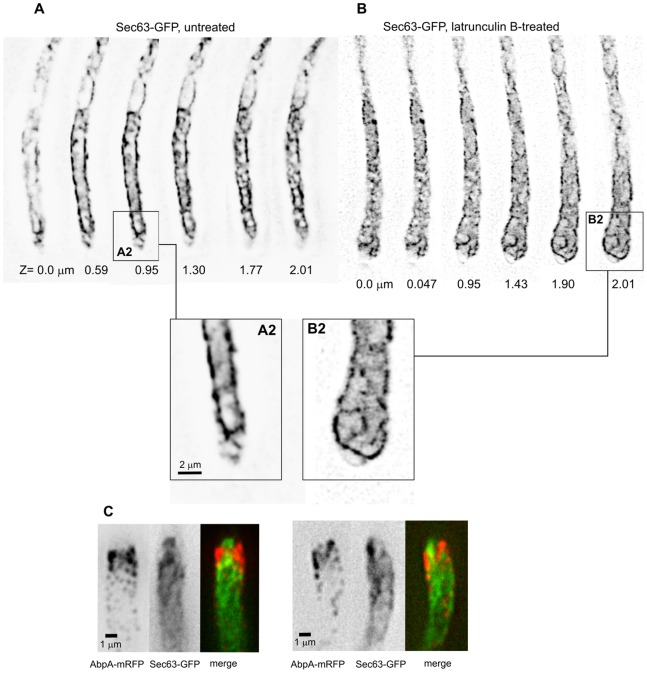
Figure 4. Role of F-actin and of the subapical collar of actin patches in determining peripheral ER morphology.
A. Individual images of a z-stack of Sec63-GFP in an untreated hyphal tip cell control. B. Individual images of a z-stack of Sec63-GFP in a hyphal tip cell treated with latrunculin B. A2 and B2 correspond to the rectangular regions indicated in A and B, respectively, shown at double magnification. C. Dual-channel images of Sec63-GFP and mRFP-AbpA. Two examples of hyphal tip cells are shown. Images represent maximal intensity projections of z-stacks treated with an ‘unsharp’ filter.

