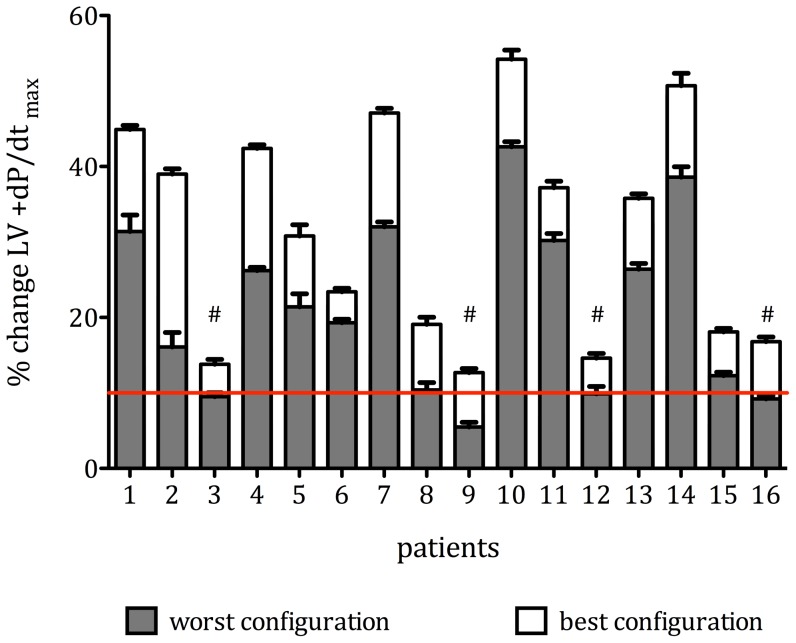
Figure 3. Comparison of optimal and worst LVPCs - Individual results in increment in mean %ΔLV +dP/dtmax (±95% confidence interval) in all patients in the optimal (white) and worst (grey) pacing configuration (p<0.0001 for all intraindividual differences).
The red line indicates a 10% increase in LV +dP/dtmax, which has been proposed as a cut-off value to separate responders from non-responders (20). By this definition, individually tailoring the optimal pacing configurations in 4 patients (marked #) transformed non-responders into responders.

