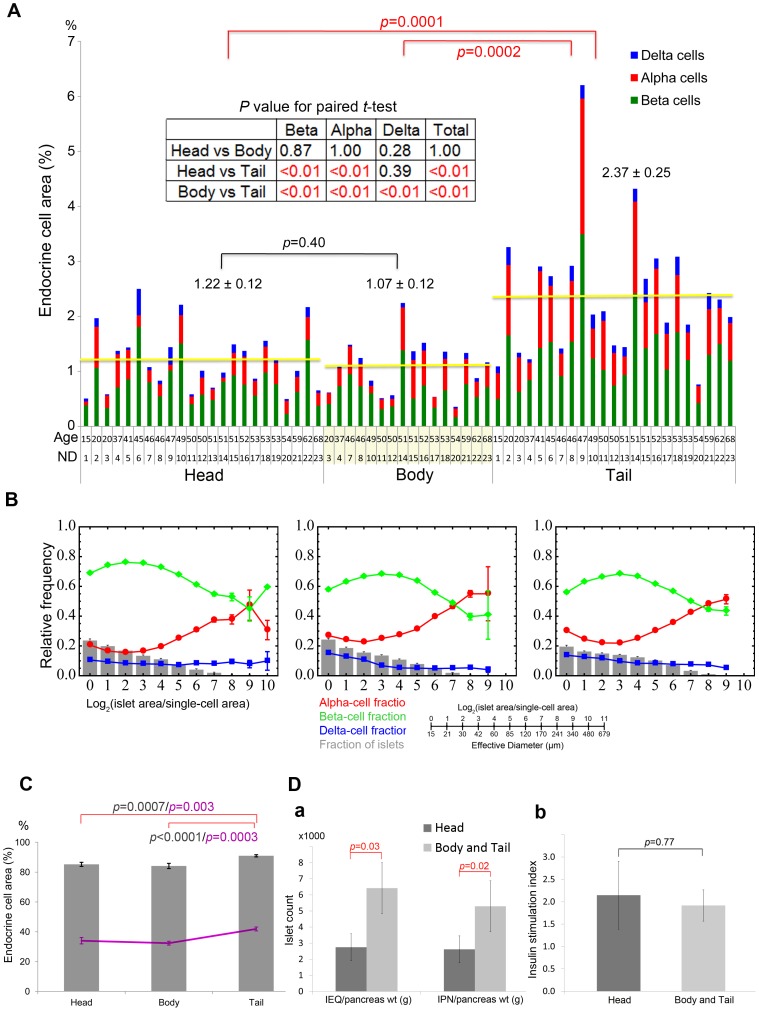
Figure 2. Regional differences in islet distribution and cellular compositions in human pancreas.
A: Inter-specimen comparison of endocrine cell mass in the head, body and tail region. Total islet cell composition (beta-cells in green, alpha-cells in red, and delta-cells in blue) in individuals with no history of diabetes. Student's t-test compared the results between each region (with red and black bars). The regional differences were further confirmed in each individual by paired t-test (inset). B: Relative frequency of islet size (gray bar) and ratios of alpha (red), beta (green), and delta (blue) cells within islets are plotted against islet size; means ±SEM. C: The percent of large islets (>50 µm in diameter) in the total number of islets/clusters (line) and in the total area (bar). D: a. Regional differences of the yield of isolated islets (>∼50 µm in diameter; n = 7). IEQ: islet equivalent number and IPN: islet particulate number. b. Insulin secretory response measured as stimulation index.

