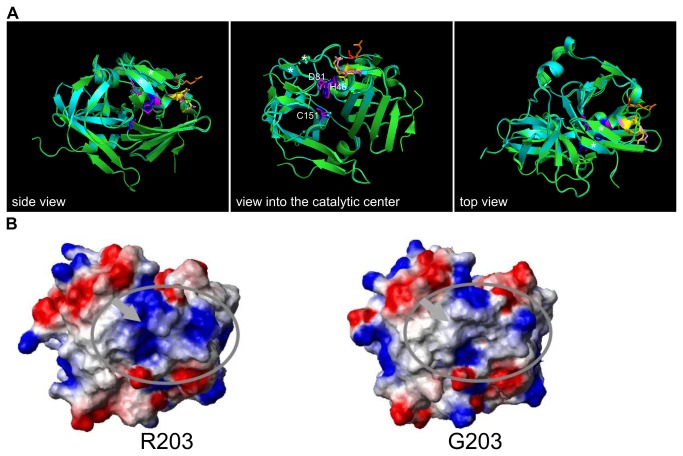
Figure 5. Structural comparison of the TEV protease with the R203G mutant.
A) Ribbon structure of the TEV protease (green) was overlaid with the mutant (dark cyan). The structure of the R203G mutant, which corresponds to R345G in the pTEV+ protease, was obtained by homology modeling using an x-ray structure of the TEV protease as template. Views from three different sides are shown. The residues of the catalytic triad H46, D81, and C151 are indicated (TEV protease: blue; mutant: magenta). The two arginine residues close to the catalytic center (R49, R50) are shown in yellow (TEV protease) and light magenta (G203 mutant). The R203 residue is shown in orange, the G203 in red. The two β-sheets, which are mentioned in the text that close the catalytic center are marked by asterisks. B) Surface charge distribution of the TEV protease compared to the R203G mutant. Surface charges were calculated using the software package MolMol. Positive charge is represented by blue color, negative charge by red color.

