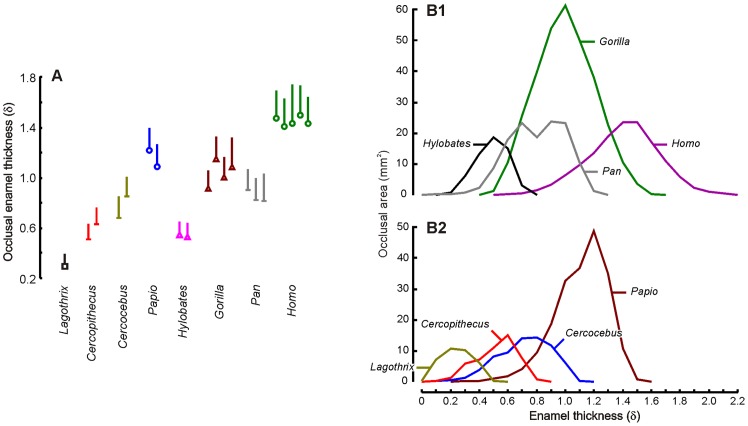
Figure 4. Enamel thickness variation.
A, occlusal enamel thickness (δ, whisker diagrams for mean and standard deviation in millimeter); B, enamel thickness distribution (within taxon average, mm) in hominoids (B1) and cercopithecoids/Lagothrix (B2) relative to the corresponding area of expression on the molars (mm2).

