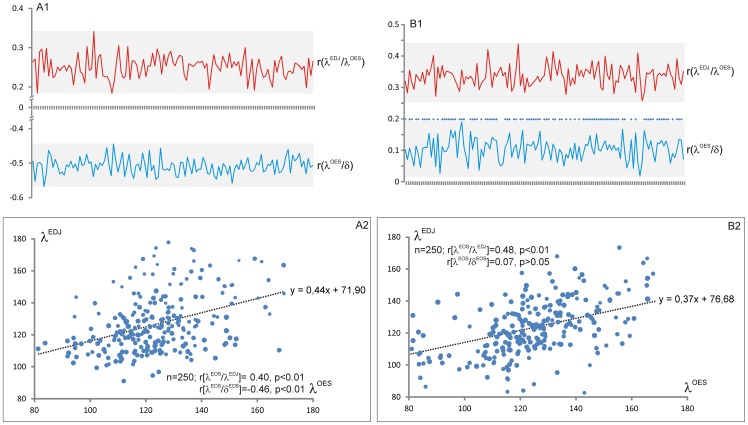
Figure 10. Relationships between inclination of OES, minimum enamel thickness and inclination of EDJ.
Example of Cercocebus (A) and Gorilla (B). The correlations and their significance between λOES and δ, and between λOES and λEDJ have been computed for about 130 subsamples of 1000 inclination and thickness values (resample with replacement on the original data) for each specimen. The correlations are significant for all λOES and λEDJ comparisons in Cercocebus (A1, red profile) and Gorilla (B1, red profile). The OES inclination is significantly correlated to the enamel thickness (albeit negatively) in Cercocebus (A1, blue profile) while λOES and δ present significant positive correlation in 72.1% of the cases in gorillas (B1, blue profile; significant correlations are marked with a blue diamond). A simplified version of the observed relationship is given for Cercocebus (A2) and Gorilla (B2) from a subsample of 250 inclination and thickness values (resample with replacement on the original data). The surfaces of the dots in A2, B2 represent minimum enamel thickness value (scale *10).

