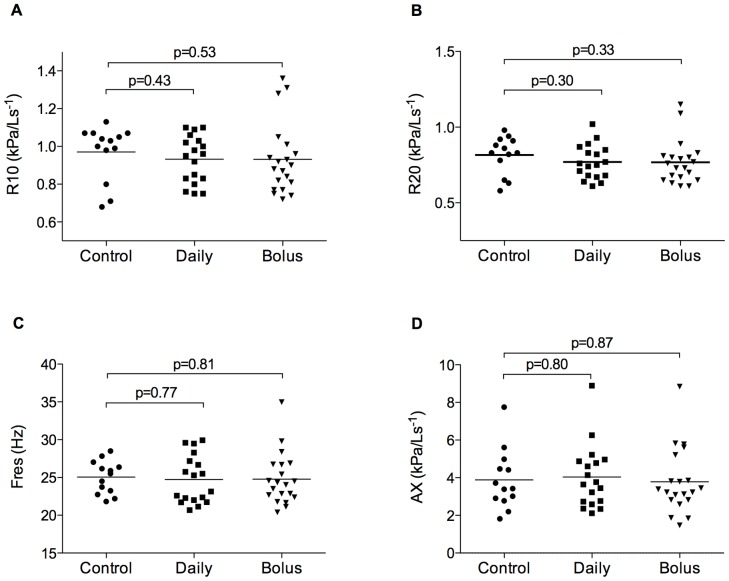
Figure 2. Baseline respiratory resistance at 10 Hz (R10, A), 20 Hz (R20, B), resonant frequency (Fres, C) and area under the reactance curve (AX, D) for control (n = 13), daily (n = 18), and bolus (n = 20) vitamin D groups at age three years.
Horizontal bars represent means. No significant difference between groups.

