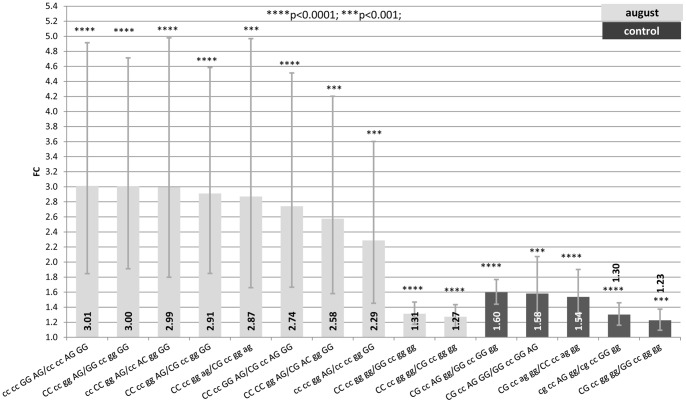
Figure 1. Fold change (FC) for the contrast among alternative genotypes G/C−660-C/A−601-G/A−522-A/G−444 of the HSP90AA1 promoter within each treatment (Control, July and August) normalized by HSP90AB1.
Segments indicate the 95% confidence interval (FCup-FClow). In abscissa the FC, in ordinate genotype contrasts. Asterisk over each bar indicates the significance level of the contrasts.

