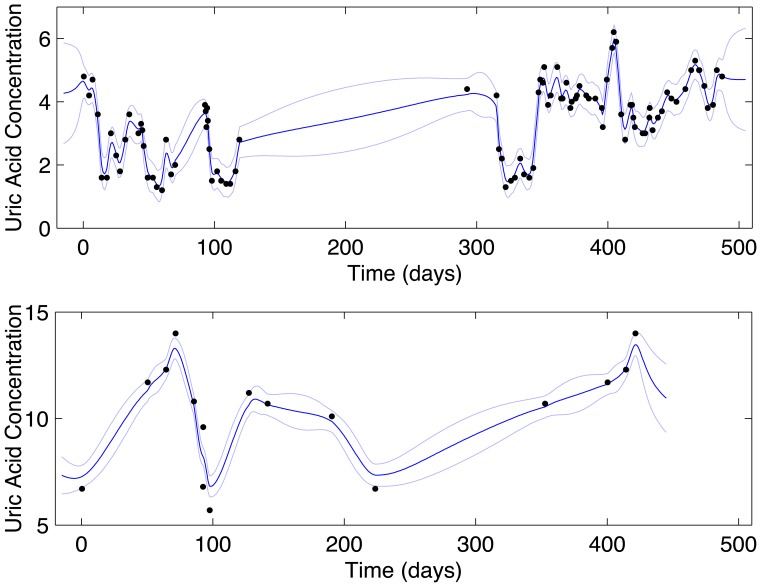
Figure 1. Gaussian process regression transforms noisy, irregular, and sparse observations to a longitudinal probability distribution.
A cross section at any point in time in these plots is a proper Gaussian probability density centered at posterior mean  with standard deviation
  . The top panel is a selected leukemia sequence, the bottom panel a selected gout sequence. Black dots: observed values. Dark blue line: posterior mean
  . Light blue lines: standard deviation
  .
.

