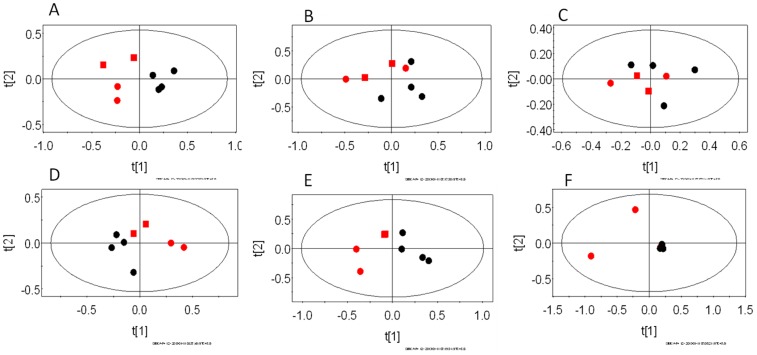
Figure 3. The PCA scores plots of 1H NMR spectra of Balb/C mice infected with P. chabaudi illustrating the segregation of uninfected control animals from animals at the peak infection stage.
The scores plots generated from PC1 and PC2 are illustrated here. The plots represent pair-wise models of different biological compartments. A–C females and D–F males. A and D - liver, B and E- serum, C and F–brain. In each plot, red symbols are uninfected control mice and black dots represent animals at peak infection stage. Among the red symbols, the squares represent the control mice sacrificed along with the peak infection animals and the circles represent the animals sacrificed with the three weeks post-parasite clearance stage animals.

