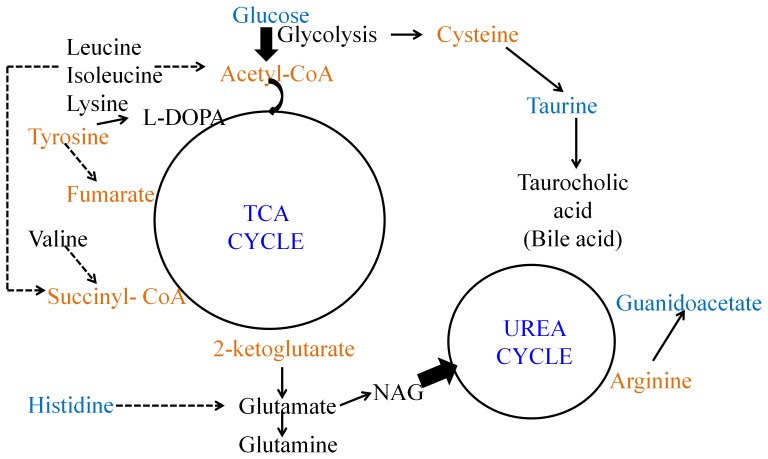
Figure 5. The probable metabolic network affected during the peak infection stage in the female liver.
Metabolites marked in black are elevated during the peak infection stage and those in blue are lowered at this stage. Metabolites in orange font did not show any significant variation and/or not detected in the 1H NMR spectra.

