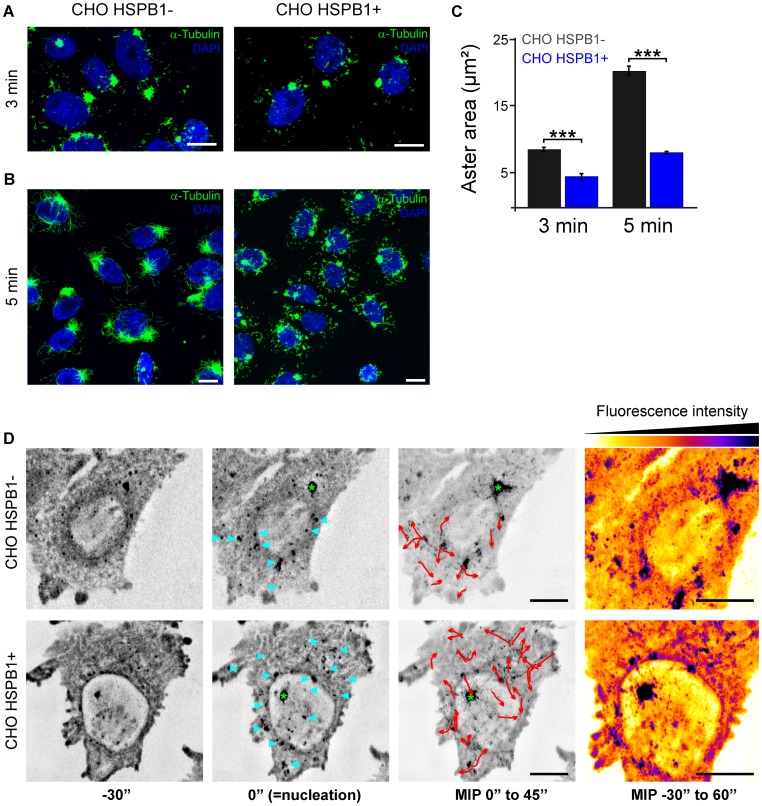
Figure 2. HSPB1 facilitates the formation of non-centrosomal microtubules in CHO cells.
Representative images from CHO HSPB1- and CHO HSPB1+ cells at (A) 3 min and (B) 5 min after nocodazole washout. Scale bar = 10 µm. For more examples, see Figure S3. (C) Quantification of the aster area of CHO HSPB1+ and CHO HSPB1- cells at 3 and 5 min after nocodazole washout (n = 90/83 and 106/106 for CHO HSPB1−/CHO HSPB1+ at 3 and 5 min respectively). Data is presented as average ± SEM. (D) Time lapse microscopy of EB1-GFP during nocodazole washout and MT polymerization in CHO HSPB1− and CHO HSPB1+ cells (see Movie S1). Image stacks comprising the complete cell volume were continuously acquired every 5 sec before, during and after nocodazole removal by medium exchange. Maximum intensity projections of all stacks were made and selected time points are shown with inverted grey scale. The appearance of the first EB1 fluorescence burst was set as time zero, which occurred within 1 min after the initiation of the washout procedure (middle images). Before the start of nucleation (left image), only static, residual EB1-GFP spots are visible. The images at the third column are maximum intensity projections (MIP) over time of 9 time points (45 sec) after nucleation. Nucleation sites are marked by blue arrowheads. 3D image deconvolution was applied on the image stacks. Red arrows show the EB1-GFP non-centrosomal comets tracked from nucleation sites. Green asterisk marks the centrosome. On the right side, MIP of the whole time sequence color-coded for intensity. Scale bar = 5 µm.

