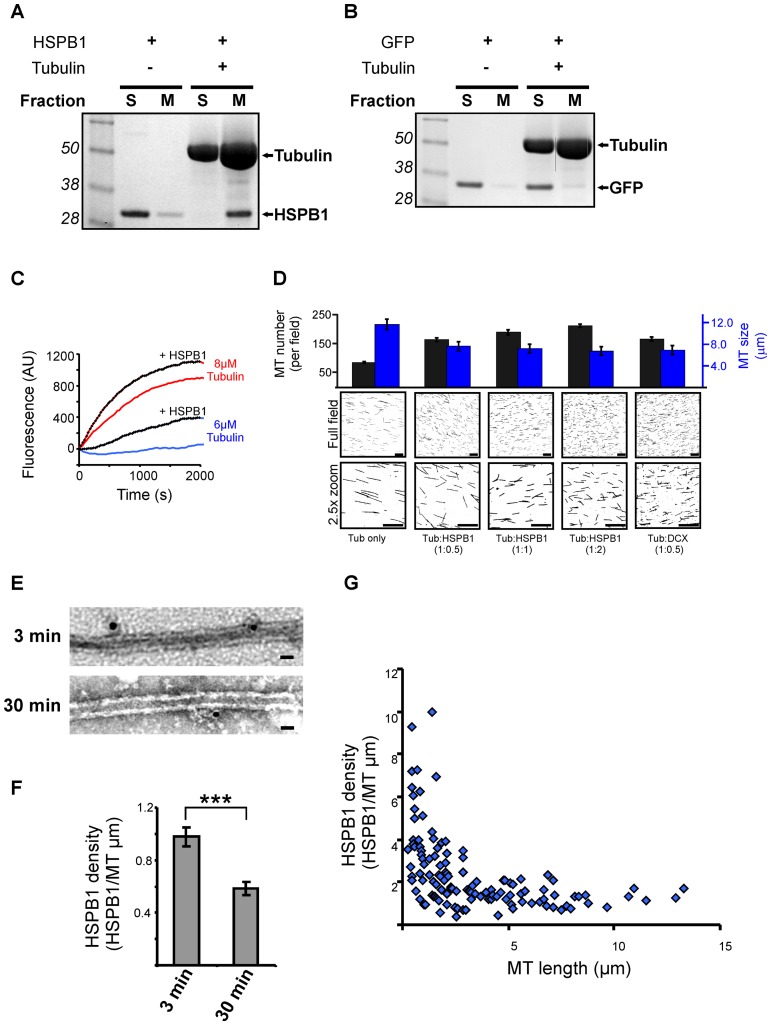
Figure 5. HSPB1 facilitates the formation of MTs in vitro and binds to MTs at early stages of their polymerization.
(A–B) Coomassie staining of MT cosedimentation assays. Pure tubulin was polymerized in the presence of (A) HSPB1 or (B) GFP for 30 min and fractionated into MT and soluble proteins fraction. Control reactions without tubulin were also used. S = soluble fraction, M = Microtubule fraction. (C) MTs were polymerized from 8 µM or 6 µM MAP-rich tubulin with or without 5 µM HSPB1. MT assembly was monitored by DAPI fluorescence. (D) MT in vitro nucleation assay. 8 µM of a 1∶10 mixture of rhodamine-labeled tubulin and MAP-rich tubulin was polymerized alone or in the presence of different concentrations of recombinant HSPB1 and doublecortin (DCX) for 5 min and spotted onto coverslips. Images from 25 random fields were used to assess number and size of microtubules. All measurements are statistically significant (p<0.01) from each other with the exception of tub:HSPB1(1∶2) and tub:DCX for MT size; and tub:HSPB1(1∶0.5) and tub:DCX for MT number. Scale bar = 20 µm. (E) MTs were polymerized from MAP-rich tubulin in the presence of HSPB1 for 3 and 30 min and visualized by TEM after immunogold staining using an anti-HSPB1 antibody. Scale bar = 50 nm. (E) MTs were polymerized from MAP-rich tubulin in the presence of HSPB1 for 3 and 30 min and visualized by TEM after immunogold staining using an anti-HSPB1 antibody. Scale bar = 50 nm. (F) Quantification of the density of MT-bound gold particles (HSPB1) (n = 105 MTs for 3 min and 110 MTs for 30 min). (G) Scatter plot showing the relationship between MT-bound HSPB1 density and MT length (n = 128 MTs) on MTs polymerized for 3 min. These two parameters showed significant negative correlation (Spearman correlation coefficient = −0.614, p<0.01). Data are presented as average ± SEM. ***p<0.001.

